spa
Estimate frequency response with fixed frequency resolution using spectral analysis
Syntax
Description
G = spa(data)data.
data contains time-domain or frequency-domain input/output
data or time series data. data can be in the form of a timetable, a comma-separated pair of numeric matrices, an iddata object,or an idfrd object that can contain complex
values.
If data is a time series, that is, contains no inputs, then
spa(data) returns the output power
spectrum along with the uncertainty. spa computes the spectra
at 128 equally spaced frequency values between 0 (excluded) and π, using a Hann
window.
If data is in the form of a timetable, the software
interprets the last variable is the single output variable. To change this
interpretation, use the InputName and
OutputName name variable arguments.
sys = spa(___,Name,Value)
For example, specify the input and output signal variable names using sys
=
spa(data,'InputName',["u1","u3"],'OutputName',["y1","y4"]).
You can use this syntax with any of the previous input-argument combinations.
Examples
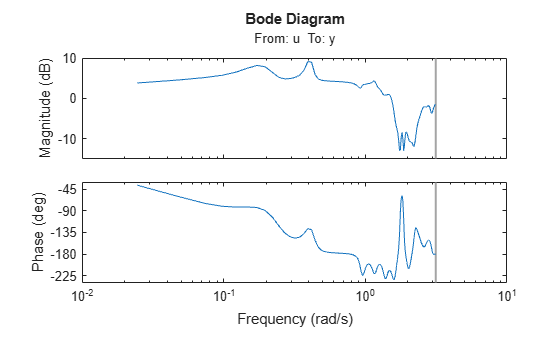
Estimate the frequency response for the input/output data in the timetable tt3. Use the default fixed resolution of 128 equally spaced logarithmic frequency values between 0 (excluded) and .
load sdata3 tt3;
g = spa(tt3);
bode(g)
Generate the logarithmically spaced vector f.
f = logspace(-2,pi,128);
Estimate the frequency response for the input/output data in matrices umat3 and ymat3. Specify the window size as [] to obtain the default lag window size.
load sdata3 umat3 ymat3;
g = spa(umat3,ymat3,[],f);
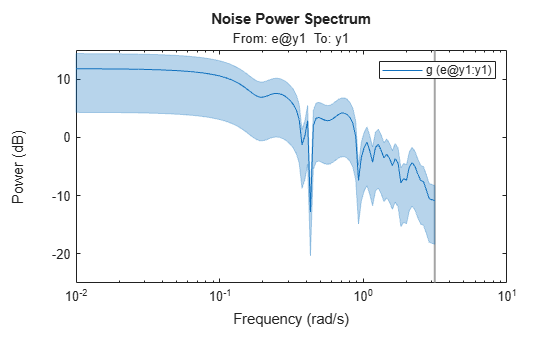
Plot the Bode response and disturbance spectrum with a confidence interval of 3 standard deviations.
h = bodeplot(g);
showConfidence(h,3)
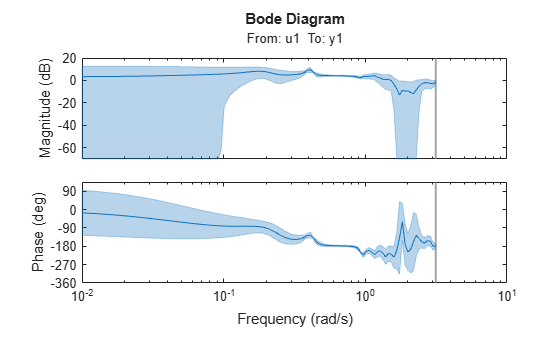
figure
h = spectrumplot(g);
showConfidence(h,3)
Input Arguments
Name-Value Arguments
Output Arguments
More About
Algorithms
spa applies the Blackman-Tukey spectral analysis method by
following these steps:
Compute the covariances and cross-covariance from u(t) and y(t):
Compute the Fourier transforms of the covariances and the cross-covariance:
where is the Hann window with a width (lag size) of M. You can specify M to control the frequency resolution of the estimate, which is approximately equal to 2π/M rad/sample time.
By default, this operation uses 128 equally spaced frequency values between 0 (excluded) and π, where
w=[1:128]/128*pi/TsandTsis the sample time of that data set. The default lag size of the Hann window isM = min(length(data)/10,30). For default frequencies, the operation uses fast Fourier transforms (FFT), which are more efficient than for user-defined frequencies.Compute the frequency-response function and the output noise spectrum .
spectrum is the spectrum matrix for both the output and the input
channels. That is, if z = [data.OutputData,
data.InputData], spectrum contains as spectrum
data the matrix-valued power spectrum of z.
Here, ' is a complex-conjugate transpose.
References
[1] Ljung, Lennart. System Identification: Theory for the User. 2nd ed. Prentice Hall Information and System Sciences Series. Upper Saddle River, NJ: Prentice Hall PTR, 1999.