Collect Ranges
After preparing the system under design for conversion as described in Prepare System for Conversion, collect ranges for the objects in your model.
Collect Ranges
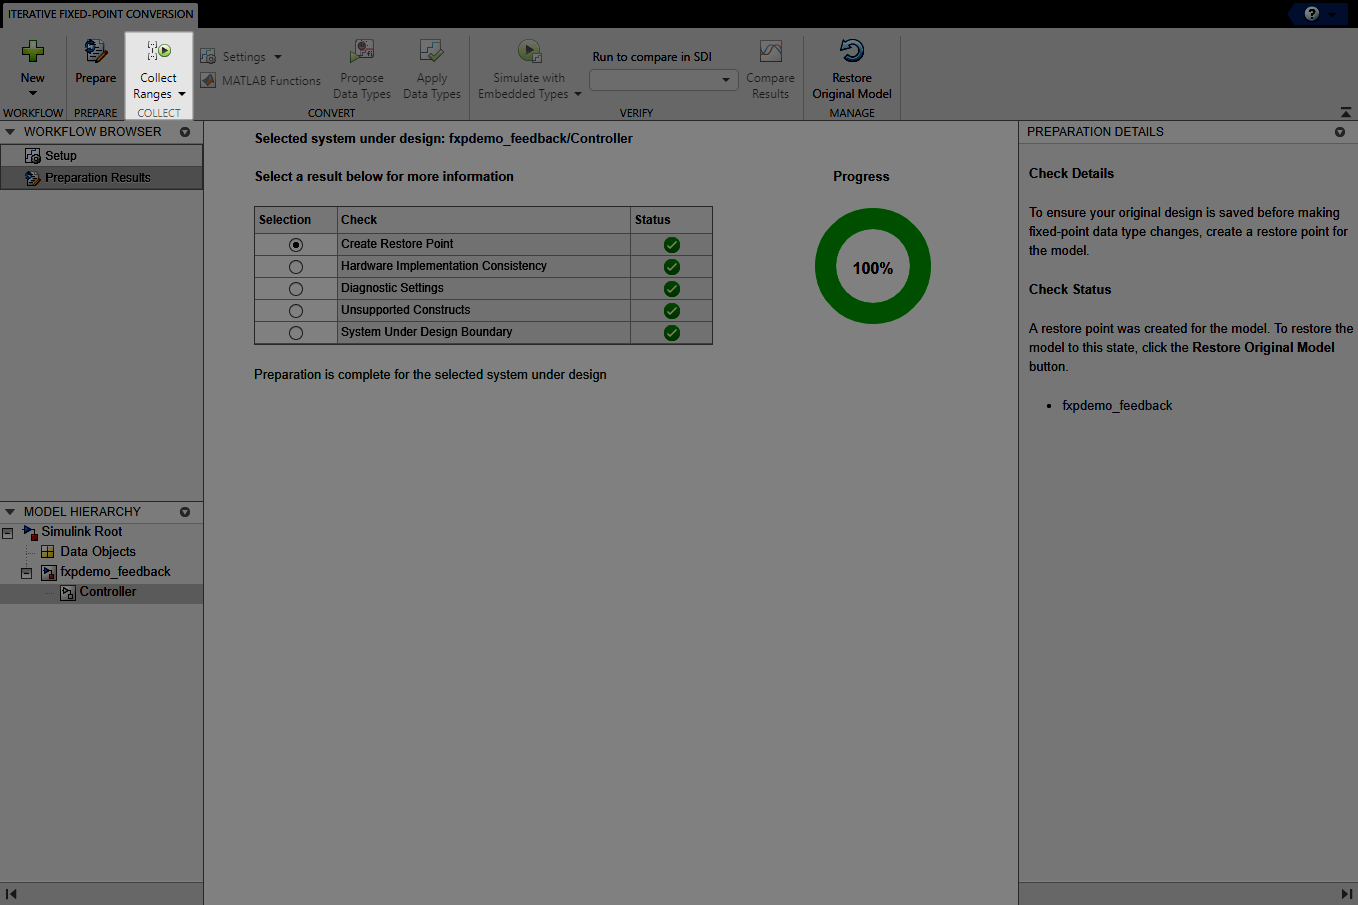
To collect ranges, click the Collect Ranges button.
If you selected to collect ranges via simulation, the Fixed-Point Tool simulates the model with instrumentation to collect minimum and maximum values for each object in your model. By default, the Fixed-Point Tool uses the current data type override set on the model. You can also use the Collect Ranges drop-down menu to override data types in your model with doubles or singles during the range collection simulation. The tool displays the results of the simulation in the spreadsheet and highlights any simulation results that have issues, such as overflows due to wrap or saturations.
Note
Data type override does not apply to Boolean or enumerated data types.
If you defined a Simulink.SimulationInput object with multiple
simulation scenarios, the Workflow Browser shows the results of each
simulation, as well as the results of all simulation scenarios merged.
If you opted to collect ranges via range analysis, the Fixed-Point Tool uses the specified design ranges to derive ranges for the remaining objects in the system under design.
If you chose to collect ranges via simulation with range analysis, the Fixed-Point Tool uses the union of ranges collected via simulation and derivation.
If the analysis successfully derives range data for the model, the Fixed-Point Tool displays the derived minimum and maximum values for the blocks in the selected system. Before proposing data types, review the results.
If the analysis fails, examine the error messages and resolve the issues. See Resolve Range Analysis Issues.
Explore Collected Ranges
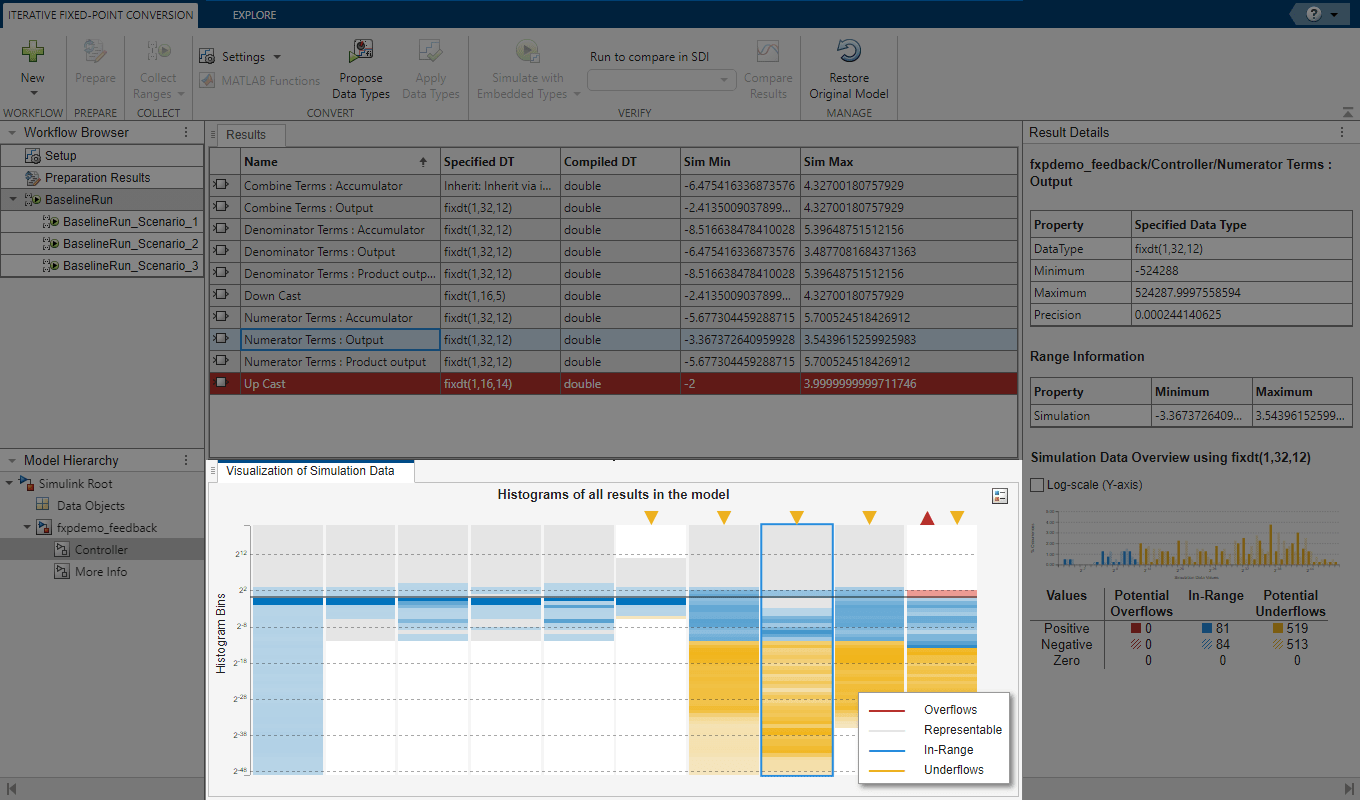
Using the Visualization of Simulation Data pane, you can view a summary of histograms of the bits used by each object in your model. Each column in the data type visualization represents a histogram for one object in your model. Each bin in a histogram corresponds to a bit in the binary word.
Selecting a column highlights the corresponding model object in the spreadsheet of the Fixed-Point Tool, and populates the Result Details pane with more detailed information about the selected result.
You can use the data type visualization to see a summary of the ranges of objects in your model and to spot sources of overflows, underflows, and inefficient data types. Using the Explore tab of the Fixed-Point Tool, you can sort and filter results in the tool based on additional criteria.
To learn about the next step in the conversion process, see Convert Data Types.