Generate VAR Model Impulse Responses
This example shows how to generate impulse responses of an interest rate shock on the US real gross domestic product (GDP) using armairf.
Load the Data_USEconModel data set. This example uses two quarterly time series: the logarithm of real GDP and the real three-month T-bill rate, both differenced to be approximately stationary. Suppose that a vector autoregression model containing the first four consecutive lags (VAR(4)) is appropriate to describe the time series.
load Data_USEconModel
DEF = log(DataTimeTable.CPIAUCSL);
GDP = log(DataTimeTable.GDP);
rGDP = diff(GDP - DEF);   % Real GDP is GDP - DEF
TB3 = 0.01*DataTimeTable.TB3MS;
dDEF = 4*diff(DEF);       % Scaling
rTB3 = TB3(2:end) - dDEF; % Real interest is deflated
Y = [rGDP,rTB3];
Fit a VAR(4) model to the data.
Mdl = varm(2,4);
Mdl.SeriesNames = {'Transformed real GDP','Transformed real 3-mo T-bill rate'};
EstMdl = estimate(Mdl,Y);
Compute and plot the orthogonalized impulse responses in one armairf call by additionally returning the handle to the plotted graphics objects (the second output). Specify the estimated innovation covariance matrix.
[YIRF,h] = armairf(EstMdl.AR,{},'InnovCov',EstMdl.Covariance);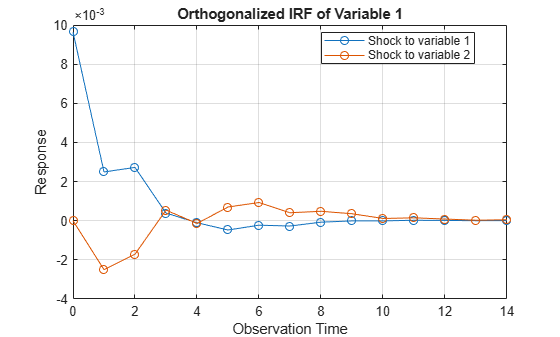
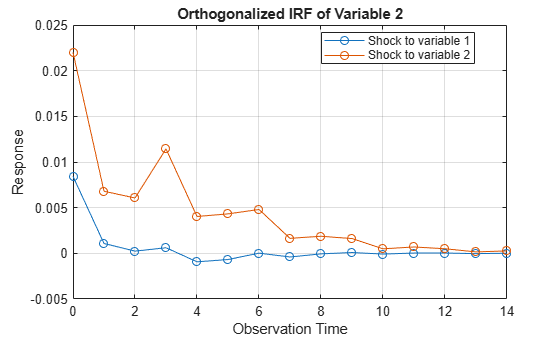
YIRF is a 15-by-2-by-2 array of impulse responses. Each row corresponds to a time in the forecast horizon (0,...,14), column j corresponds to a shock to variable Y(:,j) at time 0, and page k contains the impulse responses of a variable Y(:,k).
Obtain the deflated GDP impulse response series resulting from a shock to the interest rate series by undoing the scaling of the real GDP impulse response series.
defGDPImp = ret2price(YIRF(:,2,1));
Plot the deflated GDP impulse response series on the original scale.
figure;
numobs = size(defGDPImp,1);
plot(0:numobs - 1,defGDPImp);
title('Impact of Shock to Interest Rate on Deflated GDP')
ylabel('Deflated GDP');
xlabel('Time');
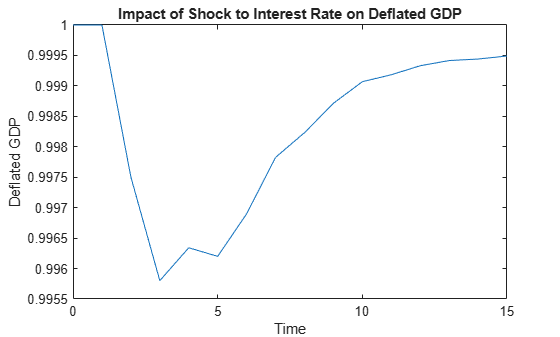
The graph shows that an increased interest rate is associated with a small dip in the deflated GDP series for a short time. Then the real GDP begins to climb again, reaching its former level in about three years.