corrplot
Plot variable correlations
Syntax
Description
[ plots Pearson's correlation coefficients
between all pairs of variables in the input matrix of time series data. The plot is a
R,PValue]
= corrplot(X)numVars-by-numVars grid, where
numVars is the number of time series variables (columns) in the data,
including the following subplots:
Each off diagonal subplot contains a scatterplot of a pair of variables with a least-squares reference line, the slope of which is equal to the displayed correlation coefficient.
Each diagonal subplot contains the distribution of a variable as a histogram.
Also, the function returns the correlation matrix in the plots and a matrix of p-values for testing the null hypothesis that each pair of coefficients is not correlated against the alternative hypothesis of a nonzero correlation.
[
plots the Pearson's correlation coefficients between all pairs of variables in the input
table or timetable, and also returns tables for the correlation matrix and matrix of
p-values.R,PValue] = corrplot(Tbl)
To select a subset of variables, for which to plot the correlation matrix, use the
DataVariables name-value argument.
[___] = corrplot(___,
specifies options using one or more name-value arguments in
addition to any of the input argument combinations in previous syntaxes.
Name=Value)corrplot returns the output argument combination for the
corresponding input arguments. For example,
corrplot(Tbl,Type="Spearman",TestR="on",DataVariables=1:5) computes
Spearman’s rank correlation coefficient for the first 5 variables of the table
Tbl and tests for significant correlation coefficients.
corrplot(___) plots the correlation matrix.
corrplot(
plots on the axes specified by ax,___)ax instead of
the current axes (gca). ax can precede any of the input
argument combinations in the previous syntaxes.
[___, plots the diagnostics of the input series and
additionally returns handles to plotted graphics objects. Use elements of
H]
= corrplot(___)H to modify properties of the plot after you create it.
Examples
Plot and return Pearson's correlation coefficients between pairs of time series using the default options of corrplot. Input the time series data as a numeric matrix.
Load data of Canadian inflation and interest rates Data_Canada.mat, which contains the series in the matrix Data.
load Data_CanadaPlot and return the correlation matrix between all pairs of variables in the data.
R = corrplot(Data)
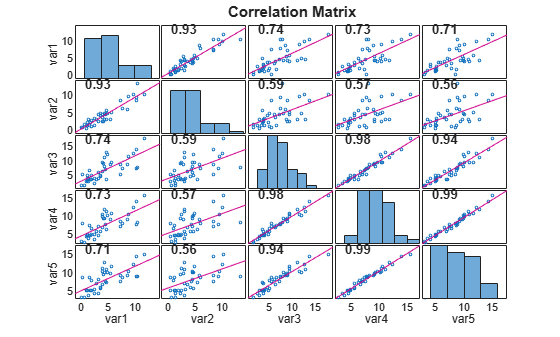
R = 5×5

    1.0000    0.9266    0.7401    0.7287    0.7136
    0.9266    1.0000    0.5908    0.5716    0.5556
    0.7401    0.5908    1.0000    0.9758    0.9384
    0.7287    0.5716    0.9758    1.0000    0.9861
    0.7136    0.5556    0.9384    0.9861    1.0000
The correlation plot shows that the short-term, medium-term, and long-term interest rates are highly correlated.
Plot correlations between time series, which are variables in a table, using default options. Return a table of pairwise correlations and a table of corresponding significance-test -values.
Load data of Canadian inflation and interest rates Data_Canada.mat. Convert the table DataTable to a timetable.
load Data_Canada
dates = datetime(dates,ConvertFrom="datenum");
TT = table2timetable(DataTable,RowTimes=dates);
TT.Observations = [];
Plot and return the correlation matrix, with corresponding significance-test -values, between all pairs of variables in the data
[R,PValue] = corrplot(TT)

R=5×5 table
              INF_C      INF_G      INT_S      INT_M      INT_L
             _______    _______    _______    _______    _______

    INF_C          1    0.92665    0.74007    0.72867     0.7136
    INF_G    0.92665          1    0.59077    0.57159    0.55557
    INT_S    0.74007    0.59077          1     0.9758    0.93843
    INT_M    0.72867    0.57159     0.9758          1    0.98609
    INT_L     0.7136    0.55557    0.93843    0.98609          1
PValue=5×5 table
               INF_C         INF_G         INT_S         INT_M         INT_L
             __________    __________    __________    __________    __________

    INF_C             1    3.6657e-18    3.2113e-08    6.6174e-08    1.6318e-07
    INF_G    3.6657e-18             1    4.7739e-05    9.4769e-05    0.00016278
    INT_S    3.2113e-08    4.7739e-05             1    2.3206e-27    1.3408e-19
    INT_M    6.6174e-08    9.4769e-05    2.3206e-27             1    5.1602e-32
    INT_L    1.6318e-07    0.00016278    1.3408e-19    5.1602e-32             1
corrplot returns the correlation matrix and corresponding matrix of -values in tables R and PValue, respectively.
By default, corrplot computes correlations between all pairs of variables in the input table. To select a subset of variables from an input table, set the DataVariables option.
Plot the correlation matrix for selected time series.
Load the credit default data set Data_CreditDefaults.mat. The table DataTable contains the default rate of investment-grade corporate bonds series (IGD, the response variable) and several predictor variables.
load Data_CreditDefaultsConsider a multiple regression model for the default rate that includes an intercept term.
Include a variable in the table of data that represents the intercept in the design matrix (that is, a column of ones). Place the intercept variable at the beginning of the table.
Const = ones(height(DataTable),1);
DataTable = addvars(DataTable,Const,Before=1);
Create a variable that contains all predictor variable names.
varnames = DataTable.Properties.VariableNames;
prednames = varnames(varnames ~= "IGD");
Graph a correlation plot of all predictor variables except for the intercept dummy variable.
corrplot(DataTable,DataVariables=prednames(2:end));
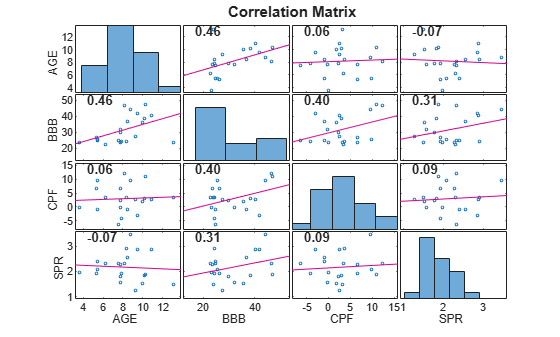
The predictor BBB is moderately linearly associated with the other predictors, while all other predictors appear unassociated with each other.
Plot Kendall's rank correlations between multiple time series. Conduct a hypothesis test to determine which correlations are significantly different from zero.
Load data on Canadian inflation and interest rates.
load Data_CanadaPlot the Kendall's rank correlation coefficients between all pairs of variables. Identify which correlations are significantly different from zero by conducting hypothesis tests.
corrplot(DataTable,Type="Kendall",TestR="on")
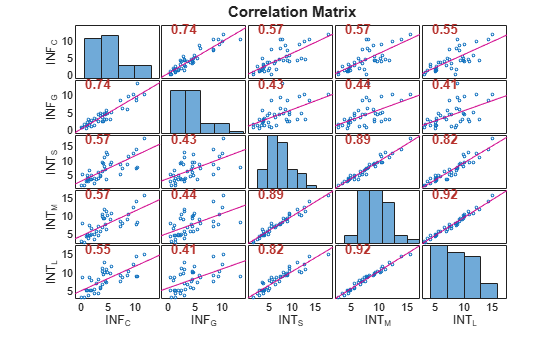
The correlation coefficients highlighted in red indicate which pairs of variables have correlations significantly different from zero. For these time series, all pairs of variables have correlations significantly different from zero.
Test for correlations greater than zero between multiple time series.
Load data on Canadian inflation and interest rates Data_Canada.mat.
load Data_CanadaReturn the pairwise Pearson's correlations and corresponding -values for testing the null hypothesis of no correlation against the right-tailed alternative that the correlations are greater than zero.
[R,PValue] = corrplot(DataTable,Tail="right");
PValue
PValue=5×5 table
               INF_C         INF_G         INT_S         INT_M         INT_L
             __________    __________    __________    __________    __________

    INF_C             1    1.8329e-18    1.6056e-08    3.3087e-08    8.1592e-08
    INF_G    1.8329e-18             1    2.3869e-05    4.7384e-05    8.1392e-05
    INT_S    1.6056e-08    2.3869e-05             1    1.1603e-27    6.7041e-20
    INT_M    3.3087e-08    4.7384e-05    1.1603e-27             1    2.5801e-32
    INT_L    8.1592e-08    8.1392e-05    6.7041e-20    2.5801e-32             1
The output PValue has pairwise -values all less than the default 0.05 significance level, indicating that all pairs of variables have correlation significantly greater than zero.
Input Arguments
Name-Value Arguments
Output Arguments
Tips
The setting
Rows="pairwise"(the default) can return a correlation matrix that is not positive definite. The settingRows="complete"returns a positive-definite matrix, but, in general, the estimates are based on fewer observations.
Algorithms
corrplotcomputes p-values for Pearson’s correlation by transforming the correlation to create a t-statistic withnumObs– 2 degrees of freedom. The transformation is exact when the input time series data is normal.corrplotcomputes p-values for Kendall’s and Spearman’s rank correlations by using either the exact permutation distributions (for small sample sizes) or large-sample approximations.corrplotcomputes p-values for two-tailed tests by doubling the more significant of the two one-tailed p-values.