Visualize Multiple Signals Using Logic Analyzer
Visualize multiple signals of a programmable FIR filter by using the Logic Analyzer app.
Open Model
Open the model by clicking the Open Model button in the Programmable FIR Filter for FPGA example.
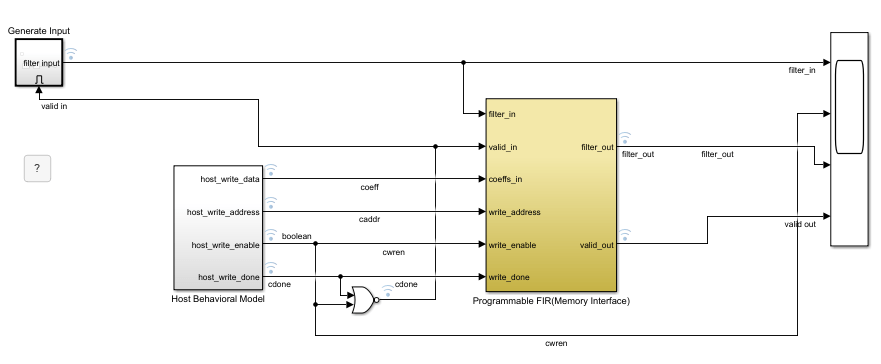
This model contains a programmable FIR filter that has two sets of coefficients. One set of coefficients has a lowpass response and the other has a highpass response. The Host Behavioral Model subsystem alternately loads the lowpass coefficients and then the highpass coefficients by using the memory interface on the Programmable FIR subsystem. The model generates input chirp data and filters the data. The Programmable FIR subsystem contains a Discrete FIR Filter block from the DSP HDL Toolbox™ library.
Run Model
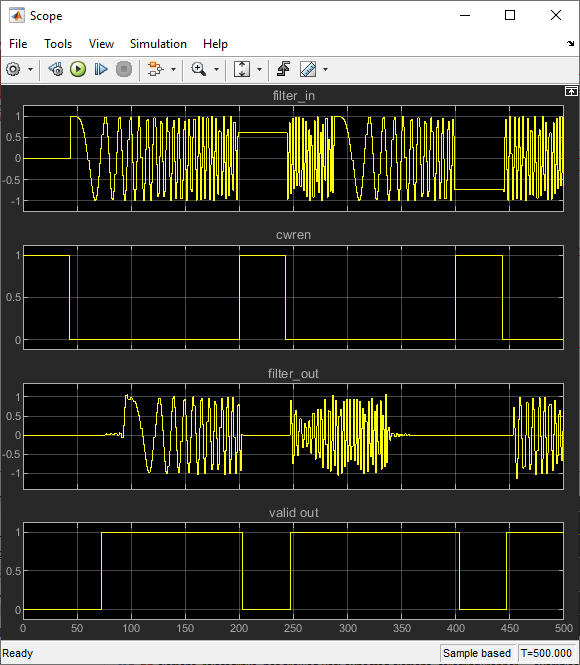
Run the model and open the Scope block. The scope displays the input data, the write enable signal that indicates when the filter coefficients switch from highpass to lowpass, and the filter output with its accompanying valid signal.
Open Logic Analyzer
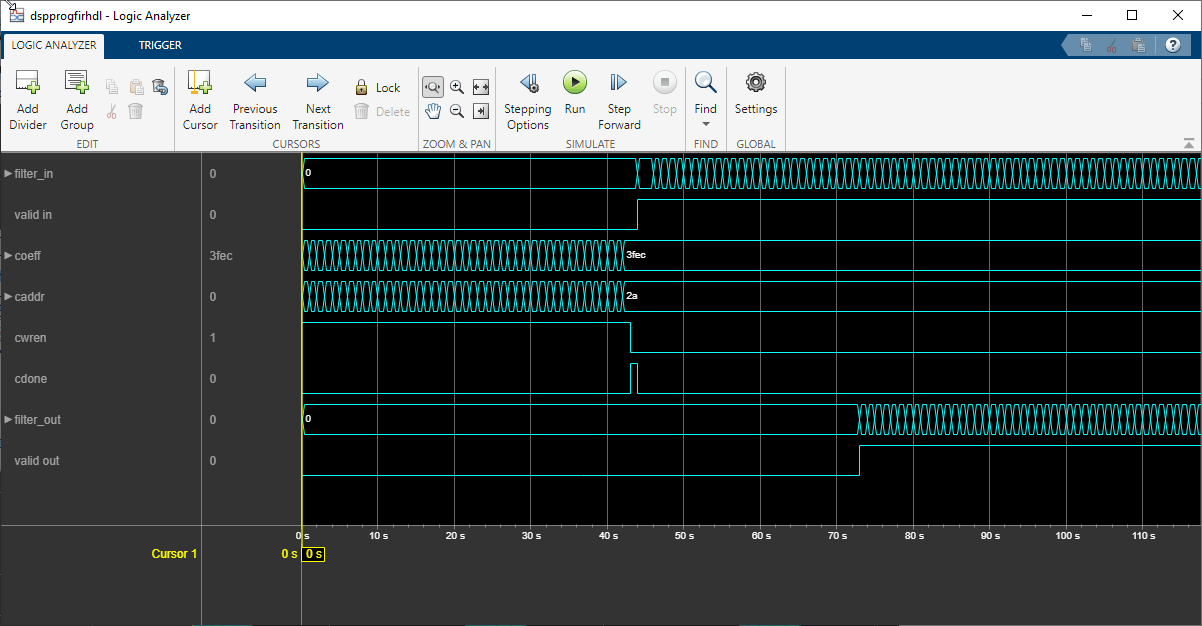
The Logic Analyzer enables you to view many signals in one window. It also makes it easy to detect signal transitions.
This model has the coefficient write interface, filter input and output, and control signals selected for streaming. To open the app, in the Review Results section of the toolbar, select Logic Analyzer.

The Logic Analyzer displays a waveform visualization of the selected signals.

Modify Waveform Display
In the Logic Analyzer, you can modify the height of all the displayed waves, and the spacing between the waves. In the Global section of the toolbar, click the Settings button. Then, modify the default height and spacing for each wave. Click Apply to show the new dimensions in the background. Click OK to dismiss the Settings window.

To zoom in on the waveform display, in the Zoom & Pan section of the toolbar, click the Zoom In Time button. Your cursor becomes a magnifying glass. Then in the waveform display, click and drag to select an area.

The Logic Analyzer now displays the time span you selected.
To zoom out from this view, in the Zoom & Pan section of the toolbar, click Fit to View.
You can also control the display of each wave. To modify an individual wave, click the signal name, then change the settings on the Wave tab.
For instance, you can display the coeff signal in signed
decimal mode by setting the Radix option to Signed
Decimal. The conversion to signed decimal format uses the
fractional and integer bits as defined for this signal in the model.

Another useful mode of visualization in the Logic Analyzer is the analog format.
To select and configure multiple signals at a time, press
Ctrl and click each signal name. In the
Wave tab, set the Formar option to
Analog. This waveform shows the
filter_in and filter_out signals in analog
format.

You can also add dividers to the display. In the Edit section of the toolbar, click the Add Divider button.
Then specify a name for your divider on the Divider tab. A divider is added underneath the selected wave. If no wave is selected, the divider is added at the bottom of the display. To move the divider, click the divider name and drag it to a new position. Alternatively, use the Move arrows on the Divider tab.

For more instructions on using the waveform display, see Logic Analyzer.
For more information on the model used in this example and how to generate HDL code from the model, see Programmable FIR Filter for FPGA.
See Also
Discrete FIR Filter (DSP HDL Toolbox)