Compute Periodogram of Signal
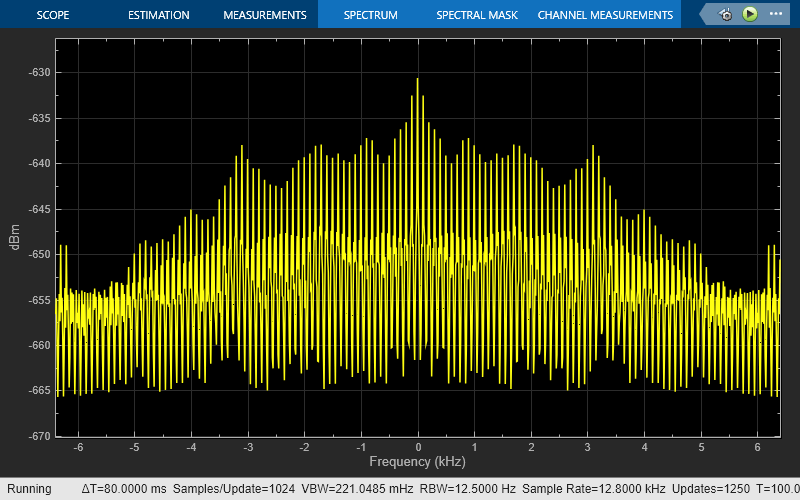
Compute the power spectral density of a signal using the Periodogram block and plot the spectral data in a Spectrum Analyzer.
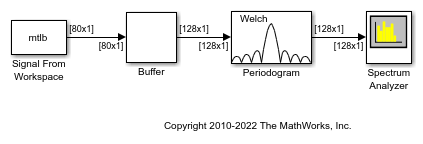
Open and run the computePeriodogram.slx model.
The Signal From Workspace block outputs a signal that has 80 samples in each frame. The Buffer block buffers the input to produce an output of 128 samples per frame. The Periodogram block estimates the power spectral density of the signal using the periodogram method. The Spectrum Analyzer shows the power spectral density data.
See Also
Signal From Workspace | Buffer | Periodogram | Spectrum Analyzer