visualize
Display response of digital downconverter or digital upconverter filter cascade
Description
visualize( plots the magnitude
response of the filter stages and the cascade response of a digital downconverter or
digital upconverter, Conv)Conv. The function plots the response of
the filters up to the second CIC null frequency (or to the first when only one CIC
null exists).
visualize(
specifies the arithmetic type of the filter stages. Set input
Conv,Arithmetic=arithType)arithType to 'double',
'single', or 'fixed-point'. When the
Conv object is in an unlocked state, you must specify the
arithmetic type. When the Conv object is in a locked state, the
object ignores the arithmetic input argument.
fvt = visualize( returns a handle
to the MATLAB® figure displaying the magnitude response.Conv)
Examples
Plot the magnitude response of the digital downconverter using the visualize function.
Create a dsp.DigitalDownConverter System object with the default settings.
dwnConv = dsp.DigitalDownConverter
dwnConv =
  dsp.DigitalDownConverter with properties:

           DecimationFactor: 100
         MinimumOrderDesign: true
                  Bandwidth: 200000
    StopbandFrequencySource: 'Auto'
             PassbandRipple: 0.1000
        StopbandAttenuation: 60
                 Oscillator: 'Sine wave'
            CenterFrequency: 14000000
        NormalizedFrequency: false
                 SampleRate: 30000000

  Show all properties
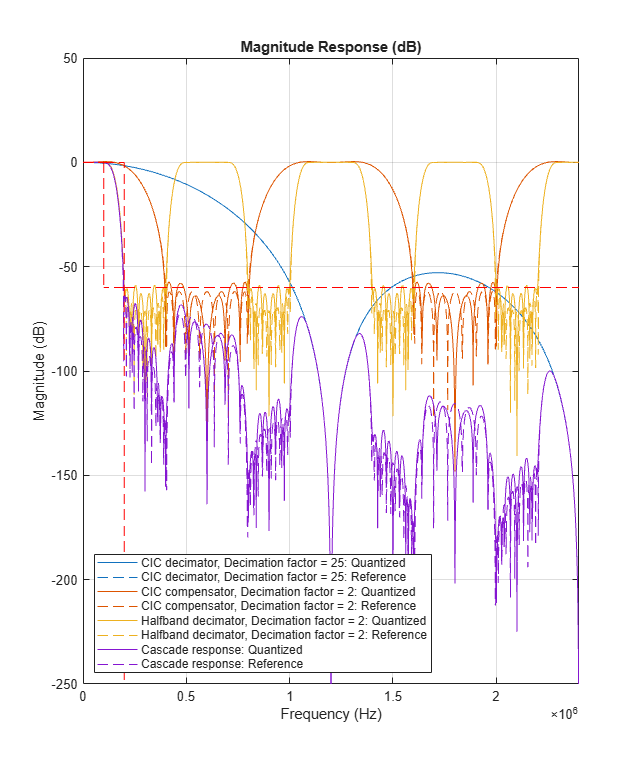
Using visualize
Using the visualize function, plot the magnitude response of the overall filter cascade and the magnitude response of the individual filter stages. Set the 'Arithmetic' property to 'fixed-point'.
visualize(dwnConv,Arithmetic='fixed-point')