EnergyDistributionDiscriminator
R2026bDescription
Add-On Required: This feature requires the AI Verification Library for Deep Learning Toolbox add-on.
The EnergyDistributionDiscriminator object is a distribution discriminator that uses
the energy method to compute distribution confidence scores. The object contains a threshold
that you can use to separate observations into in-distribution (ID) and out-of-distribution
(OOD) data sets.
Creation
Create an EnergyDistributionDiscriminator object using the networkDistributionDiscriminator function and setting the method input
argument to "energy".
Note
The object type depends on the method you specify when you use the networkDistributionDiscriminator function. The method determines how the
software computes the distribution confidence scores. You can set the method argument
to either "baseline", "odin",
"energy", "hbos", or "kde" (since R2026a). For more information, see Distribution Confidence Scores.
Properties
This property is read-only.
Method for computing the distribution confidence scores, returned as
"energy". For more information, see Distribution Confidence Scores.
This property is read-only.
Deep learning network, returned as a dlnetwork object.
This property is read-only.
Temperature scaling, returned as a positive scalar. The temperature controls the scaling of the softmax scores when the software computes the distribution confidence scores. For more information, see Distribution Confidence Scores.
Example: 1000
This property is read-only.
Distribution threshold, returned as a positive scalar. The threshold separates the ID and OOD data using the distribution confidence scores.
Example: 1.2
Object Functions
isInNetworkDistribution | Determine whether data is within the distribution of the network |
distributionScores | Distribution confidence scores |
Examples
Load a pretrained classification network.
load("digitsClassificationMLPNetwork.mat");Load ID data.
XID = digitTrain4DArrayData;
Modify the ID training data to create an OOD set.
XOOD = XID.*0.3 + 0.1;
Create a discriminator using the energy method. Set the temperature scaling to 0.1.
method = "energy"; discriminator = networkDistributionDiscriminator(net,XID,XOOD,method, ... Temperature=0.1)
discriminator =
EnergyDistributionDiscriminator with properties:
Method: "energy"
Network: [1×1 dlnetwork]
Temperature: 0.1000
Threshold: 8.7246
Assess the performance of the discriminator on the OOD data.
tf = isInNetworkDistribution(discriminator,XOOD); accuracy = sum(tf == 0)/numel(tf)
accuracy = 0.9066
More About
In-distribution (ID) data refers to any data that you use to construct and train your model. Additionally, any data that is sufficiently similar to the training data is also said to be ID.
Out-of-distribution (OOD) data refers to data that is sufficiently different to the training data. For example, data collected in a different way, at a different time, under different conditions, or for a different task than the data on which the model was originally trained. Models can receive OOD data when you deploy them in an environment other than the one in which you train them. For example, suppose you train a model on clear X-ray images but then deploy the model on images taken with a lower-quality camera.
OOD data detection is important for assigning confidence to the predictions of a network. For more information, see OOD Data Detection.
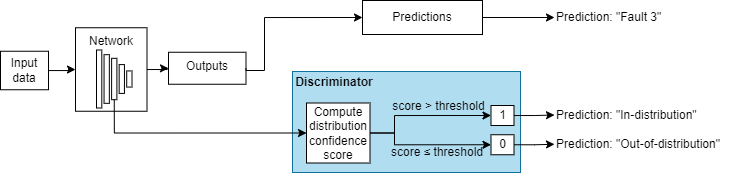
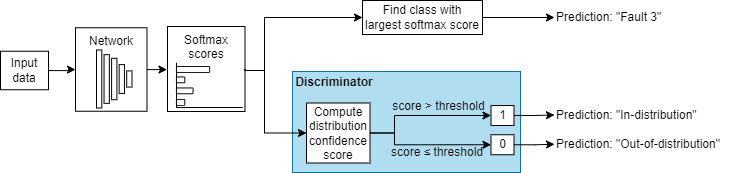
OOD data detection is a technique for assessing whether the inputs to a network are OOD. For methods that you apply after training, you can construct a discriminator which acts as an additional output of the trained network that classifies an observation as ID or OOD.
The discriminator works by finding a distribution confidence score for an input. You can then specify a threshold. If the score is less than or equal to that threshold, then the input is OOD. Two groups of metrics for computing distribution confidence scores are softmax-based and density-based methods. Softmax-based methods use the softmax layer to compute the scores. Density-based methods use the outputs of layers that you specify to compute the scores. For more information about how to compute distribution confidence scores, see Distribution Confidence Scores.
These images show how a discriminator acts as an additional output of a trained neural network.
Example Data Discriminators
| Example of Softmax-Based Discriminator | Example of Density-Based Discriminator |
|---|---|
|
For more information, see Softmax-Based Methods. |
For more information, see Density-Based Methods. |
Distribution confidence scores are metrics for classifying data as ID or OOD. If an input has a score less than or equal to a threshold value, then you can classify that input as OOD. You can use different techniques for finding the distribution confidence scores.
ID data usually corresponds to a higher softmax output than OOD data [1]. Therefore, a method of defining distribution confidence scores is as a function of the softmax scores. These methods are called softmax-based methods. These methods only work for classification networks with a single softmax output.
Let ai(X) be the input to the softmax layer for class i. The output of the softmax layer for class i is given by this equation:
where C is the number of classes and
T is a temperature scaling. When the network predicts the class
label of X, the temperature T is set to
1.
The baseline, ODIN, and energy methods each define distribution confidence scores as functions of the softmax input.
Density-based methods compute the distribution scores by describing the underlying features learned by the network as probabilistic models. Observations falling into areas of low density correspond to OOD observations.
To model the distributions of the features, you can estimate the probability density function (PDF) for each feature using a histogram or KDE. This technique is based on the histogram-based outlier score (HBOS) method [4]. These methods use a data set of ID data, such as training data, to construct histograms or kernel density estimates representing the density distributions of the ID features. These methods have three stages:
Find the principal component features for which to compute the distribution confidence scores:
For each specified layer, find the activations using the n data set observations. Flatten the activations across all dimensions except the batch dimension.
Compute the principal components of the flattened activations matrix. Normalize the eigenvalues such that the largest eigenvalue is 1 and corresponds to the principal component that carries the greatest variance through the layer. Denote the matrix of principal components for layer l by Q(l).
The principal components are linear combinations of the activations and represent the features that the software uses to compute the distribution scores. To compute the score, the software uses only the principal components whose eigenvalues are greater than the variance cutoff value σ.
Note
The HBOS and KDE algorithms assume that the features are statistically independent. The principal component features are pairwise linearly independent but they can have nonlinear dependencies. To investigate feature dependencies, you can use functions such as
corr(Statistics and Machine Learning Toolbox). For an example showing how to investigate feature dependence, see Out-of-Distribution Data Discriminator for YOLO v4 Object Detector. If the features are not statistically independent, then the algorithm can return poor results. Using multiple layers to compute the distribution scores can increase the number of statistically dependent features.
For each of the principal component features with an eigenvalue greater than σ, construct a density estimate using either a histogram (HBOS) or KDE.
For histograms, the software adjusts the width of the bins to create bins of approximately equal area, where N is the number of observations. The software then normalizes the bins such that the largest height is 1.
For KDE, the software uses the Ramer–Douglas–Peucker algorithm to reduce the number of points. The software linearly interpolates between the remaining KDE points and then normalizes the density to sum to 1.
Find the distribution score for an observation by summing the logarithmic probabilities evaluated at the observation for each of the feature density estimates, over each layer.
Let f(l)(X) denote the output of layer l for input X. Use the principal components to project the output into a lower dimensional feature space using this equation: .
Compute the confidence score using this equation:
where N(l)(σ) is the number of principal components with an eigenvalue greater than σ in layer l, L is the number of layers, and
For the HBOS method, hk(l) is the normalized histogram height.
For the KDE method, hk(l) is the reduced KDE value.
A larger score corresponds to an observation that lies in the areas of higher density. If the density estimate evaluates to 0 for any feature, for example if the observation lies outside of the range of any of the histograms, then the confidence score is
-Inf.Note
The distribution scores depend on the properties of the data set the algorithm uses to approximate the PDF.
References
[1] Shalev, Gal, Gabi Shalev, and Joseph Keshet. “A Baseline for Detecting Out-of-Distribution Examples in Image Captioning.” In Proceedings of the 30th ACM International Conference on Multimedia, 4175–84. Lisboa Portugal: ACM, 2022. https://doi.org/10.1145/3503161.3548340.
[2] Shiyu Liang, Yixuan Li, and R. Srikant, “Enhancing The Reliability of Out-of-distribution Image Detection in Neural Networks” arXiv:1706.02690 [cs.LG], August 30, 2020, http://arxiv.org/abs/1706.02690.
[3] Weitang Liu, Xiaoyun Wang, John D. Owens, and Yixuan Li, “Energy-based Out-of-distribution Detection” arXiv:2010.03759 [cs.LG], April 26, 2021, http://arxiv.org/abs/2010.03759.
[4] Markus Goldstein and Andreas Dengel. "Histogram-based outlier score (hbos): A fast unsupervised anomaly detection algorithm." KI-2012: poster and demo track 9 (2012).
[5] Jingkang Yang, Kaiyang Zhou, Yixuan Li, and Ziwei Liu, “Generalized Out-of-Distribution Detection: A Survey” August 3, 2022, http://arxiv.org/abs/2110.11334.
[6] Lee, Kimin, Kibok Lee, Honglak Lee, and Jinwoo Shin. “A Simple Unified Framework for Detecting Out-of-Distribution Samples and Adversarial Attacks.” arXiv, October 27, 2018. http://arxiv.org/abs/1807.03888.
Extended Capabilities
Usage notes and limitations:
To load a discriminator object for code generation, use the
coder.loadNetworkDistributionDiscriminatorfunction.Requires the MATLAB® Coder™ Interface for Deep Learning support package. If this support package is not installed, use the Add-On Explorer. To open the Add-On Explorer, go to the MATLAB® Toolstrip and click Add-Ons > Get Add-Ons.
Usage notes and limitations:
To load a discriminator object for code generation, use the
coder.loadNetworkDistributionDiscriminatorfunction.Requires the GPU Coder™ Interface for Deep Learning support package. If this support package is not installed, use the Add-On Explorer. To open the Add-On Explorer, go to the MATLAB® Toolstrip and click Add-Ons > Get Add-Ons.
Version History
Introduced in R2023aGenerate C or C++ code using MATLAB
Coder or generate CUDA® code for NVIDIA® GPUs using GPU Coder. For more information, see coder.loadNetworkDistributionDiscriminator.
MATLAB Command
You clicked a link that corresponds to this MATLAB command:
Run the command by entering it in the MATLAB Command Window. Web browsers do not support MATLAB commands.
Select a Web Site
Choose a web site to get translated content where available and see local events and offers. Based on your location, we recommend that you select: .
You can also select a web site from the following list
How to Get Best Site Performance
Select the China site (in Chinese or English) for best site performance. Other MathWorks country sites are not optimized for visits from your location.
Americas
- América Latina (Español)
- Canada (English)
- United States (English)
Europe
- Belgium (English)
- Denmark (English)
- Deutschland (Deutsch)
- España (Español)
- Finland (English)
- France (Français)
- Ireland (English)
- Italia (Italiano)
- Luxembourg (English)
- Netherlands (English)
- Norway (English)
- Österreich (Deutsch)
- Portugal (English)
- Sweden (English)
- Switzerland
- United Kingdom (English)