duckdb
Syntax
Description
conn = duckdb()conn is a database connection
object. Any operations that you perform on this database are lost when you close the
connection.
conn = duckdb(":memory:databaseName")conn1 = duckdb(":memory:db1") creates an in-memory connection to the
db1 database, and conn2 = duckdb(":memory:db1") creates a second
connection to the same database.
conn = duckdb(filePath)filePath includes both the location
and filename. If the database file already exists, DuckDB opens the database file and allows you to modify it. Otherwise, DuckDB creates
a new file at that location. Any operations you perform using this connection persist to the
file when you close the connection.
conn = duckdb(filePath,ReadOnly=ReadOnlyFlag)ReadOnly, to enable or disable read-only
permission. For example, conn = duckdb(filePath,ReadOnly=true) sets the
connection to read-only access.
Examples
Use the duckdb function to create a transient, in-memory DuckDB™ database connection.
conn = duckdb()
conn =
  connection with properties:

                    Database: "memory"

  Database Properties:

                    ReadOnly: false
                  AutoCommit: "on"

  Catalog and Schema Information:

              DefaultCatalog: "memory"
                    Catalogs: "memory"
                     Schemas: "main"

  Database and Driver Information:

         DatabaseProductName: "DuckDB"
      DatabaseProductVersion: "v1.3.2"
Confirm the connection is in‑memory by checking that conn.Database is "memory".
Close the database connection.
close(conn);
Create a connection to a DuckDB™ database file, import data, and perform some data analysis.
Use the duckdb function to connect to the DuckDB database file, nyctaxi.db with read-only access.
filePath = fullfile(matlabroot,"toolbox","database","dbdata","nyctaxi.db");
conn = duckdb(filePath,ReadOnly=true);
Inspect the structure of the nyctaxi database by using the sqlfind function to return a table of metadata. The database contains a table named "demo".
pattern = "";
data = sqlfind(conn,pattern)data=1×5 table
Catalog Schema Table Columns Type
_________ ______ ______ _____________________________________________________________________________________________________________________________________________________________________________________________________________________________________________________________________________________________________________________________________________________________________________________ ____________
"nyctaxi" "main" "demo" {["vendorid" "tpep_pickup_datetime" "tpep_dropoff_datetime" "passenger_count" "trip_distance" "pickup_longitude" "pickup_latitude" "ratecodeid" "store_and_fwd_flag" "dropoff_longitude" "dropoff_latitude" "payment_type" "fare_amount" "extra" "mta_tax" "tip_amount" "tolls_amount" "improvement_surcharge" "total_amount"]} "BASE TABLE"
Display the variable names.
data.Columns{1}ans = 1×19 string
"vendorid" "tpep_pickup_datetime" "tpep_dropoff_datetime" "passenger_count" "trip_distance" "pickup_longitude" "pickup_latitude" "ratecodeid" "store_and_fwd_flag" "dropoff_longitude" "dropoff_latitude" "payment_type" "fare_amount" "extra" "mta_tax" "tip_amount" "tolls_amount" "improvement_surcharge" "total_amount"
Import the "demo" data table into MATLAB®.
sqlQuery = 'SELECT * FROM main.demo';
data = fetch(conn,sqlQuery)data=10000×19 table
vendorid tpep_pickup_datetime tpep_dropoff_datetime passenger_count trip_distance pickup_longitude pickup_latitude ratecodeid store_and_fwd_flag dropoff_longitude dropoff_latitude payment_type fare_amount extra mta_tax tip_amount tolls_amount improvement_surcharge total_amount
________ ____________________ _____________________ _______________ _____________ ________________ _______________ __________ __________________ _________________ ________________ ____________ ___________ _____ _______ __________ ____________ _____________________ ____________
2 09-Jun-2015 14:58:55 09-Jun-2015 15:26:41 1 2.63 -73.983 40.73 1 "N" -73.977 40.759 2 18 0 0.5 0 0 0.3 18.8
2 09-Jun-2015 14:58:55 09-Jun-2015 15:02:13 1 0.32 -73.997 40.732 1 "N" -73.994 40.731 2 4 0 0.5 0 0 0.3 4.8
1 09-Jun-2015 14:58:56 09-Jun-2015 16:08:52 2 20.6 -73.983 40.767 2 "N" -73.798 40.645 1 52 0 0.5 10 5.54 0.3 68.34
1 09-Jun-2015 14:58:57 09-Jun-2015 15:12:00 1 1.2 -73.97 40.762 1 "N" -73.969 40.75 1 9 0 0.5 1.96 0 0.3 11.76
2 09-Jun-2015 14:58:58 09-Jun-2015 15:00:49 5 0.49 -73.978 40.786 1 "N" -73.972 40.785 2 3.5 0 0.5 0 0 0.3 4.3
2 09-Jun-2015 14:58:59 09-Jun-2015 15:42:02 1 16.64 -73.97 40.757 2 "N" -73.79 40.647 1 52 0 0.5 11.67 5.54 0.3 70.01
1 09-Jun-2015 14:58:59 09-Jun-2015 15:03:07 1 0.8 -73.976 40.745 1 "N" -73.983 40.735 1 5 0 0.5 1 0 0.3 6.8
2 09-Jun-2015 14:59:00 09-Jun-2015 15:21:31 1 3.23 -73.982 40.767 1 "N" -73.994 40.736 2 16.5 0 0.5 0 0 0.3 17.3
1 09-Jun-2015 14:59:01 09-Jun-2015 15:08:17 1 1.1 -73.949 40.788 1 "N" -73.954 40.775 1 7.5 0 0.5 0 0 0.3 8.3
2 09-Jun-2015 14:59:02 09-Jun-2015 15:19:34 6 1.79 -73.993 40.747 1 "N" -73.972 40.76 1 13.5 0 0.5 2.86 0 0.3 17.16
1 09-Jun-2015 14:59:02 09-Jun-2015 15:28:12 2 4.8 -73.984 40.756 1 "N" -73.916 40.764 1 22 0 0.5 5 0 0.3 27.8
2 09-Jun-2015 14:59:03 09-Jun-2015 15:09:21 1 0.96 -73.962 40.776 1 "N" -73.969 40.766 1 8 0 0.5 2.2 0 0.3 11
2 09-Jun-2015 14:59:03 09-Jun-2015 15:11:48 5 1.12 -73.978 40.753 1 "N" -73.99 40.747 2 9 0 0.5 0 0 0.3 9.8
1 09-Jun-2015 14:59:04 09-Jun-2015 15:04:12 1 0.7 -73.978 40.767 1 "N" -73.981 40.774 1 5.5 0 0.5 1.55 0 0.3 7.85
2 09-Jun-2015 14:59:01 09-Jun-2015 15:21:56 1 2.06 -73.969 40.786 1 "N" -73.961 40.765 1 15 0 0.5 3.95 0 0.3 19.75
1 09-Jun-2015 14:59:04 09-Jun-2015 15:17:55 1 1.6 -73.977 40.784 1 "N" -73.954 40.772 2 12.5 0 0.5 0 0 0.3 13.3
⋮
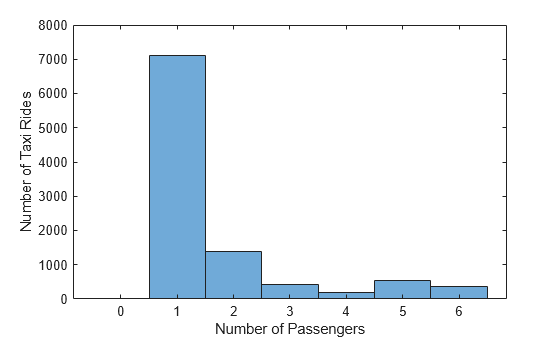
Find the minimum and maximum passenger counts per taxi ride and visualize the distribution by plotting a histogram of the passenger_count variable. Close the connection after you create the plot.
histogram(data.passenger_count)
xlabel('Number of Passengers')
ylabel('Number of Taxi Rides')
close(conn);
Input Arguments
Version History
Introduced in R2026a