Main Content

getSectorIndex

Compute conic-sector index of linear system

Description

example

RX = getSectorIndex(H,Q) computes the relative index RX for the linear system H and the conic sector specified by Q. When RX < 1, all output trajectories y(t) = Hu(t) lie in the sector defined by:

0Ty(t)TQy(t)dt<0,

for all T ≥ 0.

getSectorIndex can also check whether all I/O trajectories {u(t),y(t)} of a linear system G lie in the sector defined by:

0T(y(t)u(t))TQ(y(t)u(t))dt<0,

for all T ≥ 0. To do so, use getSectorIndex with H = [G;I], where I = eyes(nu), and nu is the number of inputs of G.

For more information about sector bounds and the relative index, see About Sector Bounds and Sector Indices.

RX = getSectorIndex(H,Q,tol) computes the index with relative accuracy specified by tol.

RX = getSectorIndex(H,Q,tol,fband) computes the passivity index by restricting the inequalities that define the index to a specified frequency interval. This syntax is available only when Q has as many negative eigenvalues as there are inputs in H.

example

[RX,FX] = getSectorIndex(___) also returns the frequency FX at which the index value RX is achieved. FX is set to NaN when the number of negative eigenvalues in Q differs from the number of inputs in H. You can use this syntax with any of the previous combinations of input arguments.

[RX,FX,W1,W2,Z] = getSectorIndex(___) also returns the decomposition of Q into its positive and negative parts, as well as the spectral factor Z when Q is dynamic. When Q is a matrix (constant sector bounds), Z = 1. You can use this syntax with any of the previous combinations of input arguments.

DX = getSectorIndex(H,Q,dQ) computes the index in the direction specified by the matrix dQ. If DX > 0, then the output trajectories of H fit in the conic sector specified by Q. For more information about the directional index, see About Sector Bounds and Sector Indices.

The directional index is not available if H is a frequency-response data (frd) model.

DX = getSectorIndex(H,Q,dQ,tol) computes the index with relative accuracy specified by tol.

Examples

collapse all

Test whether, on average, the I/O trajectories of G(s)=(s+2)/(s+1) belong within the sector defined by:

S={(y,u):0.1u2<uy<10u2}.

In U/Y space, this sector is the shaded region of the following diagram.

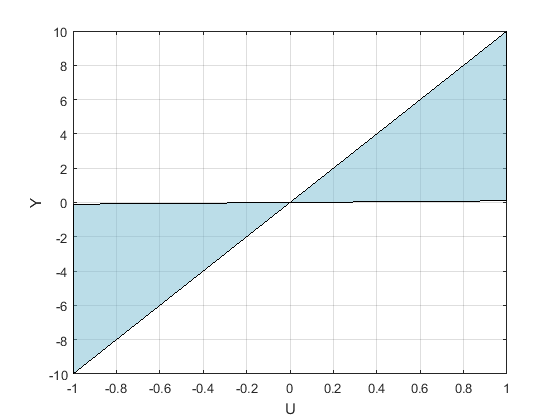
The Q matrix corresponding to this sector is given by:

Q=[1-(a+b)/2-(a+b)/2ab];a=0.1,b=10.

A trajectory y(t)=Gu(t) lies within the sector S when for all T > 0,

0.10Tu(t)2<0Tu(t)y(t)dt<100Tu(t)2dt.

To check whether trajectories of G satisfy the sector bound, represented by Q, compute the R-index for H = [G;1].

G = tf([1 2],[1 1]); 

a = 0.1;  b = 10;
Q = [1 -(a+b)/2 ; -(a+b)/2 a*b];

R = getSectorIndex([G;1],Q)
R = 0.4074

This resulting R is less than 1, indicating that the trajectories fit within the sector. The value of R tells you how much tightly the trajectories fit in the sector. This value, R = 0.41, means that the trajectories would fit in a narrower sector with a base 1/0.41 = 2.4 times smaller.

For systems with complex coefficients, getSectorIndex can return indices at a negative or a positive frequency depending on the fband you specify.

Load a state-space model with complex coefficients and complex sector matrix.

load dataSysQ sys Q

Compute the R-index and its frequency with a relative accuracy of 0.0001%. Also, specify fband = [1,10] to compute the index in the frequency interval [–10,–1] ∪ [1,10].

[R,FX] = getSectorIndex(sys,Q,1e-6,[1,10])
R = 1.5811
FX = -7.2320

In this interval, sys achieves an index of 1.5811 at a negative frequency value of –7.2320 rad/s. Use sectorplot to plot the indices in this range.

opt = sectorplotoptions;
opt.FreqScale = 'Linear';
opt.IndexScale = 'Linear';
w = linspace(-10,10,1000);
sectorplot(sys,Q,w,opt)

Figure contains an axes object. The axes object contains 2 objects of type line. This object represents sys.

Now compute the index in the frequency interval [–5,–1] ∪ [1,5]. To do so, specify fband = [1,5].

[r,f] = getSectorIndex(sys,Q,1e-6,[1,5])
r = 1.4630
f = 2.2499

In this interval, sys achieves an index of 1.4630 at a positive frequency value of 2.2499 rad/s. Plot the indices in this range to confirm the result.

w = linspace(-5,5,500);
sectorplot(sys,Q,w,opt)

Figure contains an axes object. The axes object contains 2 objects of type line. This object represents sys.

Input Arguments

collapse all

Model to analyze against sector bounds, specified as a dynamic system model such as a tf, ss, or genss model. H can be continuous or discrete. If H is a generalized model with tunable or uncertain blocks, getSectorIndex analyzes the current, nominal value of H.

To analyze whether all I/O trajectories {u(t),y(t)} of a linear system G lie in a particular sector, use H = [G;I].

If H is a model array, then getSectorIndex returns the passivity index as an array of the same size, where:

index(k) = getSectorIndex(H(:,:,k),___)

Here, index is either RX, or DX, depending on which input arguments you use.

Sector geometry, specified as:

  • A matrix, for constant sector geometry. Q is a symmetric square matrix that is ny on a side, where ny is the number of outputs of H.

  • An LTI model, for frequency-dependent sector geometry. Q satisfies Q(s)’ = Q(–s). In other words, Q(s) evaluates to a Hermitian matrix at each frequency.

The matrix Q must be indefinite to describe a well-defined conic sector. An indefinite matrix has both positive and negative eigenvalues.

For more information, see About Sector Bounds and Sector Indices.

Relative accuracy for the calculated sector index. By default, the tolerance is 1%, meaning that the returned index is within 1% of the actual index.

Frequency interval for calculating the sector index, specified as an array of the form [fmin,fmax] with 0 ≤ fmin < fmax. When you provide fband, getSectorIndex restricts to the specified frequency interval the inequalities that define the index.

For models with complex coefficients, getSectorIndex computes the index in the range [–fmax,–fmin][fmin,fmax]. As a result, the function can return indices at a negative frequency.

Specify frequencies in units of rad/TimeUnit, where TimeUnit is the TimeUnit property of the dynamic system model H.

Direction in which to compute directional sector index, specified as a nonnegative definite matrix. The matrix dQ is a symmetric square matrix that is ny on a side, where ny is the number of outputs of H.

Output Arguments

collapse all

Relative index of the system H for the sector specified by Q, returned as a scalar value, or an array if H is an array. If RX < 1, then the output trajectories of H fit inside the cone of Q.

The value of RX provides a measure of how tightly the output trajectories of H fit inside the cone. Let the following be an orthogonal decomposition of the symmetric matrix Q into its positive and negative parts.

Q=W1W1TW2W2T,W1TW2=0.

(Such a decomposition is readily obtained from the Schur decomposition of Q.) Then, RX is the smallest R that satisfies:

0Ty(t)T(W1W1TR2W2W2T)y(t)dt<0,

for all T ≥ 0. Varying R is equivalent to adjusting the slant angle of the cone specified by Q until the cone fits tightly around the output trajectories of H. The cone base-to-height ratio is proportional to R.

For more information about interpretations of the relative index, see About Sector Bounds and Sector Indices.

Frequency at which the index RX is achieved, returned as a scalar, or an array if H is an array. In general, the index varies with frequency (see sectorplot). The returned value is the largest value over all frequencies. FX is the frequency at which this value occurs, returned in units of rad/TimeUnit, where TimeUnit is the TimeUnit property of H.

FX can be negative for systems with complex coefficients.

Positive and negative factors of Q, returned as matrices. For a constant Q, W1 and W2 satisfy:

Q=W1W1TW2W2T,W1TW2=0.

Bistable model in the factorization of Q, returned as:

  • If Q is a constant matrix, Z = 1.

  • If Q is frequency-dependent, then Z is a state-space (ss) model such that:

Q(jω)=Z(jω)H(W1W1TW2W2T)Z(jω).

Directional sector index of the system H for the sector specified by Q in the direction dQ, returned as a scalar value, or an array if H is an array. The directional index is the largest τ which satisfies:

0Ty(t)T(Q+τdQ)y(t)dt<0,

for all T ≥ 0.

Version History

Introduced in R2016a