Analog Passband Modulation Examples
These examples show the basic workflows for analog passband modulation and demodulation. Elements of the examples apply to other analog modulation techniques as well.
Note
The analog modulation Simulink® blocks in Communications Toolbox™ process only sample-based scalar signals. The analog modulator and demodulator accept real-valued input signals and return real-valued output signals. The analog demodulator blocks return discrete-time (not continuous-time) output.
Represent Analog Signals for Amplitude Modulation in MATLAB
Represent single-channel and multichannel analog signals for amplitude modulation in MATLAB®.
Define variables for the sampling rate, carrier frequency, and sampling times. Create a sinewave sampled at the sampling time increments. For sample time increments represented by t, the vector x results from sampling a sine wave 8000 times per second for 0.1 seconds. Use the ammod function to amplitude modulate the sine wave, and then plot the signals.
Fs = 8000;                 % Sampling rate in samples per second
Fc = 300;                  % Carrier frequency in Hz
t = [0:0.1*Fs]'/Fs;        % Sampling times for 0.1 seconds
x = sin(20*pi*t);          % Representation of the signal

y = ammod(x,Fc,Fs);        % Modulate x to produce y
figure;
subplot(2,1,1); plot(t,x); % Plot x on top
subplot(2,1,2); plot(t,y)  % Plot y below

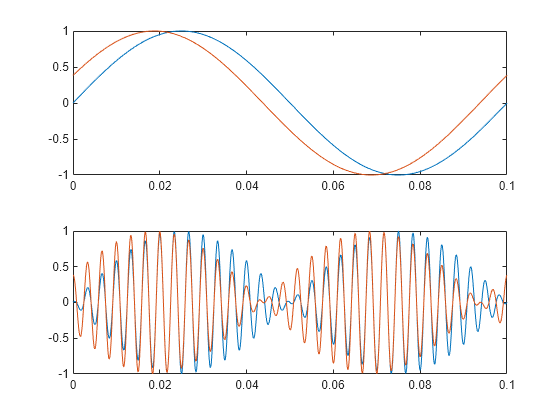
Define a multichannel signal containing two sine waves. The first channel is a sinusoid with zero initial phase and the second channel is a sinusoid with an initial phase of pi/8. Use the ammod function to amplitude modulate the sine waves, and then plot the signals.
Fs = 8000;
t = [0:.1*Fs]'/Fs;
x = [sin(20*pi*t),sin(20*pi*t+pi/8)];

y = ammod(x,Fc,Fs);        % Modulate x to produce y
figure;
subplot(2,1,1); plot(t,x); % Plot x on top
subplot(2,1,2); plot(t,y)  % Plot y below
Phase-Modulate Analog Signals in AWGN Channel
Prepare to sample a signal for two seconds at a rate of 100 samples per second.
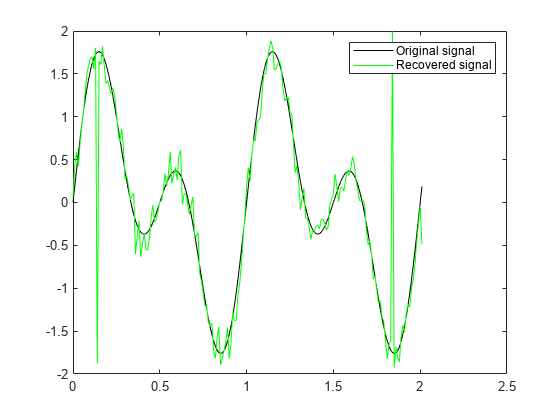
Define variables for the sampling rate, carrier frequency, sampling times, and phase deviation. Create a signal as the sum of a one-cycle and a two-cycle sinusoid. For sample time increments represented by t, the vector x results from summing two sine waves 100 times per second for 2 seconds. Use the pmmod function to phase-modulate the sine wave x. Add Gaussian white noise to the modulated signal, use the pmdemod function to recover the original signal, and then plot the orignal and recovered signals.
Fs = 100;           % Sampling rate
Fc = 10;            % Carrier frequency in Hz
t = [0:2*Fs+1]'/Fs; % Time points for sampling
phasedev = pi/2;    % Phase deviation for phase modulation

x = sin(2*pi*t) + sin(4*pi*t);

y = pmmod(x,Fc,Fs,phasedev);   % Modulate.
y = awgn(y,10,'measured',103); % Add noise.
z = pmdemod(y,Fc,Fs,phasedev); % Demodulate.
% Plot the original and recovered signals.
figure; plot(t,x,'k-',t,z,'g-');
legend('Original signal','Recovered signal');
Analog Modulation Filtering Examples
Filter Cutoff Frequency Variation in Simulink
When you apply filtering to a signal, s, selecting an initial cutoff frequency equal to half the carrier frequency is typically a good starting point. Because the carrier frequency must be higher than the bandwidth of the message signal, a cutoff frequency chosen in this way properly filters out unwanted frequency components. If the cutoff frequency is too high, unwanted out-of-band interference may not be filtered out. If the cutoff frequency is too low, the filtering may narrow the bandwidth of the message signal and inband message content may be filtered out. Filtering causes a delay between a demodulated signal and the original transmitted signal. The filter order and other filter parameters affect the length of this delay.
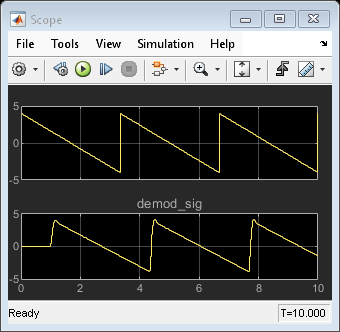
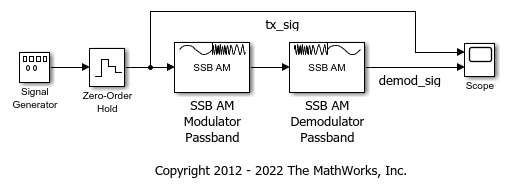
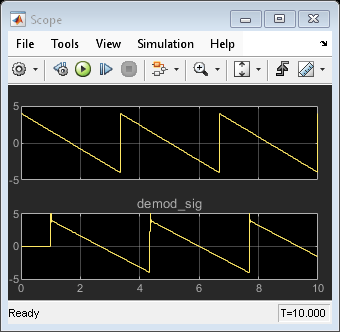
The doc_sawtooth_mod model applies single-sideband amplitude modulation (SSB-AM) to a 0.3 Hz sawtooth message signal onto a 25 Hz carrier signal, demodulates the resulting signal using a Butterworth filter, and plots the original and recovered signals. The Butterworth filter is implemented within the SSB AM Demodulator Passband block. To see how different lowpass filter cutoff frequencies affect the recovered signal, simulate the system with the cutoff frequency of the SSB AM Demodulator Passband block set to 30 Hz, 49 Hz, and 4 Hz. Plot the transmitted and demodulated signal for each run.
Simulate and plot waveform with cutoff frequency set to 30 Hz. The recovered signal is delayed but demodulated signal looks clean.
Simulate and plot waveform with cutoff frequency set to 49 Hz. The higher cutoff frequency allows the carrier signal to interfere with the demodulated signal.

Simulate and plot waveform with cutoff frequency set to 4 Hz. The lower cutoff frequency narrows the bandwidth of the demodulated signal and clips the demodulated signal.