msdotplot
Plot set of peak lists from LC/MS or GC/MS data set
Syntax
Description
msdotplot(
plots a set of peak lists from a liquid chromatography/mass spectrometry (LC/MS) or gas
chromatography/mass spectrometry (GC/MS) data set represented by
Peaklist,Times)Peaklist, a cell array of peak lists, where each element is a
two-column matrix with m/z values in the first column and ion intensity values in the second
column, and Times, a vector of retention times associated with the
spectra. Peaklist and Times have the same number
of elements. The data is plotted into any existing figure generated by the msheatmap function. Otherwise, the data is plotted into a new Figure
window.
msdotplot(___,Quantile=
plots only the most intense peaks, specifically those in the percentage above the specified
QuantileValue)QuantileValue.
PlotHandle = msdotplot(___)get function to display a list of the plot's properties. You can
use this handle as input to the set function to change the plot's
properties, including showing and hiding points.
Examples
Load a MAT-file, included with the Bioinformatics Toolbox™ software, which contains LC/MS data variables, including ms_peaks and ret_time.
ms_peaksis a cell array of peak lists, where each element is a two-column matrix of m/z values and ion intensity values, and each element corresponds to a spectrum or retention time.ret_timeis a column vector of retention times associated with the LC/MS data set.
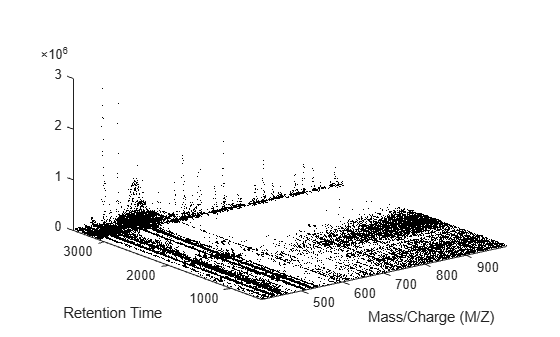
load lcmsdata Create a dot plot with only the 5% most intense peaks.
msdotplot(ms_peaks,ret_time,Quantile=0.95)
Resample the data, then create a heat map of the LC/MS data.
[MZ,Y] = msppresample(ms_peaks,5000);
msheatmap(MZ,ret_time,log(Y))
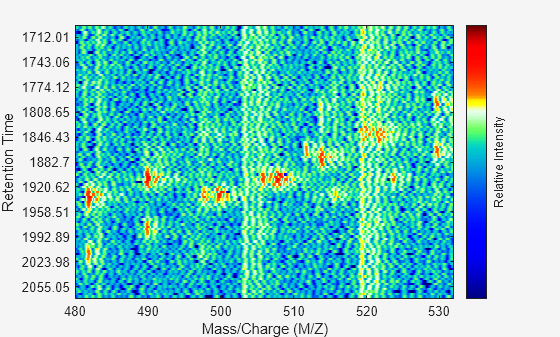
Overlay the dot plot on the heat map, and then zoom in to see the detail.
msdotplot(ms_peaks,ret_time)
axis([480 532 375 485])
Input Arguments
Output Arguments
Version History
Introduced in R2007a
See Also
mspalign | msbackadj | msalign | msheatmap | mslowess | msnorm | mspeaks | msresample | msppresample | mssgolay | msviewer
Topics
- Mass Spectrometry and Bioanalytics
- Preprocessing Raw Mass Spectrometry Data
- Visualizing and Preprocessing Hyphenated Mass Spectrometry Data Sets for Metabolite and Protein/Peptide Profiling
- Differential Analysis of Complex Protein and Metabolite Mixtures Using Liquid Chromatography/Mass Spectrometry (LC/MS)