3-D Sound Event Localization and Detection Using Trained Recurrent Convolutional Neural Network
In this example, you perform 3-D sound event localization and detection (SELD) using a pretrained deep learning model. For details about the model and how it was trained, see Train 3-D Sound Event Localization and Detection (SELD) Using Deep Learning. The SELD model uses two B-format ambisonic audio recordings to detect the presence and location of one of 14 sound classes commonly found in an office environment.
Download Pretrained Network
Download the pretrained SELD network, ambisonic test files, and labels. The model architecture is based on [1] and [3]. The data the model was trained on, the labels, and the ambisonic test files, are provided as part of the L3DAS21 challenge [2].
downloadFolder = matlab.internal.examples.downloadSupportFile("audio","SELDmodel.zip");
dataFolder = tempdir;
unzip(downloadFolder,dataFolder)
netFolder = fullfile(dataFolder,"SELDmodel");
addpath(netFolder)
Load and Inspect Data
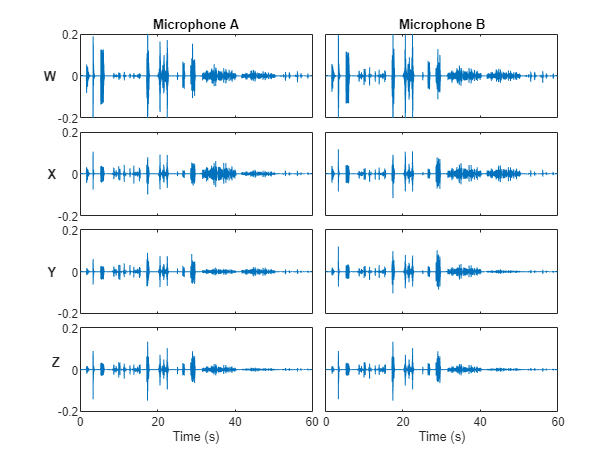
Load the ambisonic data. First order B-format ambisonic recordings contain components that correspond to the sound pressure captured by an omnidirectional microphone (W) and sound pressure gradients X, Y, and Z that correspond to front/back, left/right, and up/down captured by figure-of-eight capsules oriented along the three spatial axes.
[micA,fs] = audioread("micA.wav");
micB = audioread("micB.wav");
Listen to a section of the data.
microphone =1; channel =
2; start =
21.5; stop =
39.7; s = [micA,micB]; data = s(round(start*fs):round(stop*fs),channel+(microphone-1)*4); sound(data,fs)
Plot the waveforms.
plotAmbisonics(micA,micB)
Use the supporting function, getLabels, to load the ground truth labels associated with the sound event detection (SED) and direction of arrival (DOA).
[sedLabels,doaLabels] = getLabels();
sedLabels is a T-by-1 vector of keys over time, where the values map to one of 14 possible sound classes. A key of zero indicates a region of silence. The 14 possible sound classes are chink/clink, keyboard, cupboard, drawer, female speech, finger snapping, keys jangling, knock, laughter, male speech, printer, scissors, telephone, and writing.
sedLabels
sedLabels = 600×1 single column vector

    0
    0
    0
    0
    0
    0
    0
    0
    0
    0
    0
    0
    0
    0
    0
      ⋮
soundClasses = getSoundClasses();
soundClasses(sedLabels+1)
ans = 1×600 categorical array
    "Silence"    "Silence"    "Silence"    "Silence"    "Silence"    "Silence"    "Silence"    "Silence"    "Silence"    "Silence"    "Silence"    "Silence"    "Silence"    "Silence"    "Silence"    "Cupboard"    "Cupboard"    "Cupboard"    "Cupboard"    "Cupboard"    "Cupboard"    "Cupboard"    "Cupboard"    "Cupboard"    "Cupboard"    "Cupboard"    "Cupboard"    "Silence"    "Silence"    "Silence"
doaLabels is a T-by-3 matrix where T is the number of time steps and 3 corresponds to the X, Y, and Z axes in 3-D space.
doaLabels
doaLabels = 600×3

    0    0    0
    0    0    0
    0    0    0
    0    0    0
    0    0    0
    0    0    0
    0    0    0
    0    0    0
    0    0    0
    0    0    0
    0    0    0
    0    0    0
    0    0    0
    0    0    0
    0    0    0
      ⋮
In both cases, the 60-second ground truth has been discretized into 600 time steps.
Perform 3-D Sound Event Localization and Detection (SELD)
Use the supporting object, seldModel, to perform SELD. The object encapsulates the SELD model developed in Train 3-D Sound Event Localization and Detection (SELD) Using Deep Learning. Create the model, then call seld on the ambisonic data to detect and localize sound in time and space.
If you have Statistics and Machine Learning Toolbox™, the model applies smoothing to the decisions using moving averages and clustering.
model = seldModel();
[sed,doa] = seld(model,micA,micB);
To visualize the system's performance over time, call the supporting function plot2d.
plot2d(sedLabels,doaLabels,sed,doa)

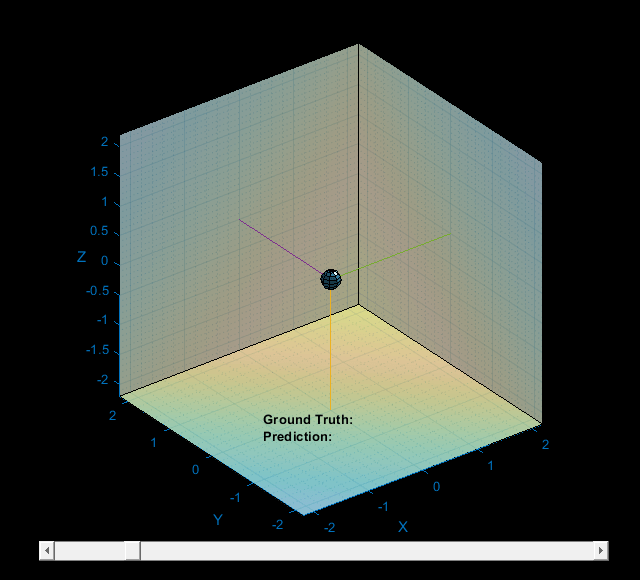
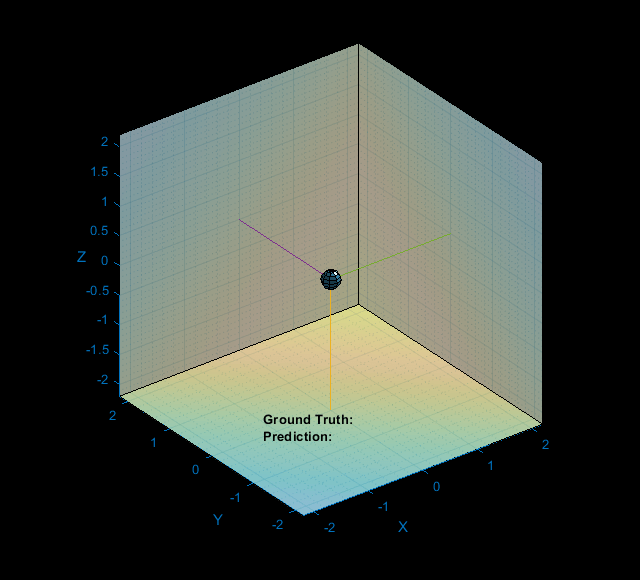
To visualize the system's performance in three spatial dimensions, call the supporting function plot3d. You can move the slider to visualize sound event locations detected at different times. The ground truth source location is identified by a semi-transparent sphere. The predicted source location is identified by a circle connected to the original by a dotted line.
plot3d(sedLabels,doaLabels,sed,doa);
SELD is a 4D problem, in that you are localizing the sound source in 3-D space and 1D time. To examine the system's performance in 4D, call the supporting function plot4d. The plot4d function plays the 3-D plot and corresponding ambisonic recording over time.
plot4d(micA(:,1),sedLabels,doaLabels,sed,doa)
Supporting Functions
Plot Ambisonics
function plotAmbisonics(micA,micB)
%PLOTAMBISONICS Plot B-format ambisonics over time
% plotAmbisonics(micA,micB) plots the ambisonic recordings collected from
% micA and micB. The channels are plotted along the rows of a 4-by-2 tiled
% layout (W,X,Y,Z). The first column of the plot corresponds to data from
% microphone A and the second column corresponds to data from microphone B.

figure(1)
tiledlayout(4,2,TileSpacing="tight")

t = linspace(0,60,size(micA,1));

nexttile
plot(t,micA(:,1))
title("Microphone A")
yL = ylabel("W",FontWeight="bold");
set(yL,Rotation=0,VerticalAlignment="middle",HorizontalAlignment="right")
axis([t(1),t(end),-0.2,0.2])
set(gca,Xticklabel=[])

nexttile
plot(t,micB(:,1))
title("Microphone B")
axis([t(1),t(end),-0.2,0.2])
set(gca,Yticklabel=[],XtickLabel=[])

nexttile
plot(t,micA(:,2))
yL = ylabel("X",FontWeight="bold");
set(yL,Rotation=0,VerticalAlignment="middle",HorizontalAlignment="right")
axis([t(1),t(end),-0.2,0.2])
set(gca,Xticklabel=[])

nexttile
plot(t,micB(:,2))
axis([t(1),t(end),-0.2,0.2])
set(gca,Yticklabel=[],XtickLabel=[])

nexttile
plot(t,micA(:,3))
yL = ylabel("Y",FontWeight="bold");
set(yL,Rotation=0,VerticalAlignment="middle",HorizontalAlignment="right")
axis([t(1),t(end),-0.2,0.2])
set(gca,Xticklabel=[])

nexttile
plot(t,micB(:,3))
axis([t(1),t(end),-0.2,0.2])
set(gca,Yticklabel=[],XtickLabel=[])

nexttile
plot(t,micB(:,4))
yL = ylabel("Z",FontWeight="bold");
set(yL,Rotation=0)
axis([t(1),t(end),-0.2,0.2])
xlabel("Time (s)")

nexttile
plot(t,micB(:,4))
axis([t(1),t(end),-0.2,0.2])
set(gca,Yticklabel=[])
xlabel("Time (s)")
end
Plot Time Series
function plotTimeSeries(sed,values)
%PLOTTIMESERIES Plot time series
% plotTimeSeries(sed,values) is leveraged by plot2d to plot the color-coded
% SED or DOA estimation.

colors = getColors();
hold on
for ii = 1:numel(sed)
    cls = sed(ii);
    if cls > 0
        x = [ii-1,ii];
        y = repelem(values(ii),2);
        plot(x,y,Color=colors{cls},LineWidth=8)
    end
end
hold off
grid on
end
Plot 2D
function plot2d(sedLabels,doaLabels,sed,doa)
%PLOT2D Plot 2D
% plot2d(sedLabels,doaLabels,sed,doa) creates plots for SED, SED ground
% truth, DOA estimation, and DOA ground truth.

fh = figure(2);
set(fh,Position=[100 100 800 800])

SoundClasses = ["Clink","Keyboard","Cupboard","Drawer","Female","Fingers Snap", ...
    "Keys","Knock","Laughter","Male","Printer","Scissors","Telephone","Writing"];

tiledlayout(5,2,TileSpacing="tight")

nexttile([2,1])
plotTimeSeries(sedLabels,sedLabels);
yticks(1:14)
yticklabels(SoundClasses)
ylim([0.5,14.5])
ylabel("Class")
title("Ground Truth")
set(gca,Xticklabel=[])

nexttile([2,1])
plotTimeSeries(sed,sed);
yticks(1:14)
ylim([0.5,14.5])
title("Prediction")
set(gca,Yticklabel=[],XtickLabel=[])

nexttile
plotTimeSeries(sedLabels,doaLabels(:,1));
yL = ylabel("X",FontWeight="bold");
set(yL,Rotation=0,VerticalAlignment="middle",HorizontalAlignment="right")
set(gca,Xticklabel=[])

nexttile
plotTimeSeries(sed,doa(:,1));
set(gca,Yticklabel=[],XtickLabel=[])


nexttile
plotTimeSeries(sedLabels,doaLabels(:,2));
yL = ylabel("Y",FontWeight="bold");
set(yL,Rotation=0,VerticalAlignment="middle",HorizontalAlignment="right")
set(gca,Xticklabel=[])

nexttile
plotTimeSeries(sed,doa(:,2));
set(gca,Yticklabel=[],XtickLabel=[])

nexttile
plotTimeSeries(sedLabels,doaLabels(:,3));
xlabel("Frame")
yL = ylabel("Z",FontWeight="bold");
set(yL,Rotation=0,VerticalAlignment="middle",HorizontalAlignment="right")

nexttile
plotTimeSeries(sed,doa(:,3));
xlabel("Frame")
set(gca,YtickLabel=[])

end
Plot 3-D
function data = plot3d(sedLabels,doaLabels,sed,doa,nvargs)
%PLOT3D Plot 3-D
% plot3d(sedLabels,doaLabels,sed,doa) creates a 3-dimensional plot with a
% slider. Moving the slider moves the frame in the plot. The location of
% the recording is located at the origin. The location of a sound event is
% noted by a semi-transparent orb. The location of the estimated sound
% event is noted by a filled circle connected to the origin by a line. The
% estimated sound event class and the true sound event class for the
% current frame are displayed on the plot.
%
% plot3d(sedLabels,doaLabels,sed,doa,IncludeSlider=false) creates a 3-D plot
% but does not add the slider and associated callback. This format of the
% plot is leveraged by plot4d.

arguments
    sedLabels
    doaLabels
    sed
    doa
    nvargs.IncludeSlider = true;
end

% Create data struct to contain plot information.
data.sedLabels = sedLabels;
data.doaLabels = doaLabels;
data.sed = sed;
data.doa = doa;
data.Colors = getColors();
data.SoundClasses = ["Clink","Keyboard","Cupboard","Drawer","Female","Fingers Snap", ...
    "Keys","Knock","Laughter","Male","Printer","Scissors","Telephone","Writing"];

% Create figure.
if nvargs.IncludeSlider
    data.FigureHandle = figure(3);
else
    data.FigureHandle = figure(4);
end
set(data.FigureHandle,Position=[680,400,640,580],Color="k",MenuBar="none",Toolbar="none")

% Initialize plot.
data = initialize3DPlot(data);

% Add slider for 3-D plot.
if nvargs.IncludeSlider
    N = numel(data.sedLabels);
    frame = 1/N;
    b = uicontrol(Parent=data.FigureHandle,Style="slider",Position=[40,20,380,20], ...
        value=frame*80,min=1/N,max=1,units="pixel", ...
        SliderStep=[1/N,20/N]);
    cbk = @(es,ed)update3DPlot(es.Value,data);
    addlistener(b,ContinuousValueChange=cbk);
end

end
Initialize 3-D Plot
function data = initialize3DPlot(data)
%INITIALIZE3DPLOT Initialize 3-D plot
% data = initialize3DPlot(data) creates the 3-D plot and initializes lines,
% dots, and surfaces that are included in the plot. data is appended to
% include handles for figure properties.

% Make sure the figure is visible.
data.FigureHandle.Visible = "on";

% Initialize the line plot that connects origin to predicted location.
data.YPlot = plot3([0,1],[0,1],[0,1],":",Color="k",LineWidth=1.5);
hold on
data.YPlot.Visible = "off";

% Initialize the dot plot that marks the predicted location.
data.YPlotDot = plot3(0,0,0,"o",MarkerSize=8,MarkerEdgeColor="k",LineWidth=2,MarkerFaceColor="k");
data.YPlotDot.Visible = "off";

% Initialize the sphere that marks the target location.
[x,y,z] = sphere;
data.TPlotDot = surf(x,y,z,FaceAlpha=0.2,EdgeColor="none",FaceColor="b");
data.TPlotDot.Visible = "off";

% Create a sphere to mark the origin. This is where the ambisonic
% microphones are located.
light
[X,Y,Z] = sphere(8);
surf(X*0.15,Y*0.15,Z*0.15,FaceColor=[0.3010 0.7450 0.9330],LineWidth=0.25);

% Create 'walls' on the 3-D plot to aid 3-D visualization.
patch([2.2,2.2,2.2,2.2],[2.2,2.2,-2.2,-2.2],[-2.2,2.2,2.2,-2.2],[3,2,1,2],FaceAlpha=0.5,FaceColor="interp");
patch([2.2,2.2,-2.2,-2.2],[2.2,2.2,2.2,2.2],[-2.2,2.2,2.2,-2.2],[3,2,1,2],FaceAlpha=0.5,FaceColor="interp")
patch([2.2,2.2,-2.2,-2.2],[2.2,-2.2,-2.2,2.2],[-2.2,-2.2,-2.2,-2.2],[3,2,1,2],FaceAlpha=0.5,FaceColor="interp")

% Create guidelines on the 3-D plot to aid 3-D visualization.
plot3([0,0],[0,0],[-2.2,0])
plot3([0,0],[2.2,0],[0,0])
plot3([2.2,0],[0,0],[0,0])

% Set axes limits.
xlim([-2,2])
ylim([-2,2])
zlim([-2,2])

% Add axis labels.
xlabel("X",Color=[0,0.4470,0.7410]);
ylabel("Y",Color=[0,0.4470,0.7410]);
zlabel("Z",Color=[0,0.4470,0.7410],Rotation=0);
set(gca,XColor=[0,0.4470,0.7410],YColor=[0,0.4470,0.7410],ZColor=[0,0.4470,0.7410])

% Initialize annotations for the ground truth and predicted labels.
annotation("textbox",[0.35,0.2,0.6,0.1],String="Ground Truth: ",FitBoxToText="on",Color="k",EdgeColor="none",FontWeight="bold");
annotation("textbox",[0.35,0.17,0.4,0.1],String="Prediction: ",FitBoxToText="on",Color="k",EdgeColor="none",FontWeight="bold");
data.GTAnnotation = annotation("textbox",[0.55,0.2,0.6,0.1],String=" ",FitBoxToText="on",Color="k",EdgeColor="none",FontWeight="bold");
data.PredictedAnnotation = annotation("textbox",[0.55,0.17,0.4,0.1],String=" ",FitBoxToText="on",Color="k",EdgeColor="none",FontWeight="bold");

grid on
grid minor
axis equal
hold off
end
Update 3-D Plot
function update3DPlot(timeFrame,data)
%UPDATE3DPLOT Update 3-D Plot
% update3DPlot(timeFrame,data) updates the 3-D plot to display data
% corresponding to the specified time frame.

timeFrame = round(timeFrame*numel(data.sedLabels));

if data.sedLabels(timeFrame) > 0
    % Turn plot visibility on.
    data.TPlotDot.Visible = "on";
    data.GTAnnotation.Visible = "on";

    % Get the current target sound class.
    gtClass = data.SoundClasses{data.sedLabels(timeFrame)};

    % Get current location coordinates and SED color code.
    doa = data.doaLabels(timeFrame,:);
    tcol = data.Colors{data.sedLabels(timeFrame)};

    % Update target sphere.
    [x,y,z] = sphere;
    r = 0.2;
    data.TPlotDot.XData = x*r + doa(1);
    data.TPlotDot.YData = y*r + doa(2);
    data.TPlotDot.ZData = z*r + doa(3);
    data.TPlotDot.FaceColor = tcol;
    data.TPlotDot.MarkerEdgeColor = tcol;
else
     % Turn plot visibility off.
    data.TPlotDot.Visible = "off";
    data.GTAnnotation.Visible = "off";

    % Set the current target sound class to silence and color-code as
    % black.
    gtClass = "Silence";
    tcol = "k";
end

if data.sed(timeFrame) > 0
    % Turn plot visibility on.
    data.PredictedAnnotation.Visible = "on";
    data.YPlot.Visible = "on";
    data.YPlotDot.Visible = "on";

    % Get the current predicted sound class.
    pClass = data.SoundClasses{data.sed(timeFrame)};

    % Get current location coordinates and SED color code.
    doa = data.doa(timeFrame,:);
    pcol = data.Colors{data.sed(timeFrame)};

    % Update prediction line.
    data.YPlot.XData = [0,doa(1)];
    data.YPlot.YData = [0,doa(2)];
    data.YPlot.ZData = [0,doa(3)];
    data.YPlot.Color = pcol;

    % Update the prediction dot.
    data.YPlotDot.XData = doa(1);
    data.YPlotDot.YData = doa(2);
    data.YPlotDot.ZData = doa(3);
    data.YPlotDot.Color = pcol;
    data.YPlotDot.MarkerEdgeColor = pcol;
    data.YPlotDot.MarkerFaceColor = pcol;
else
    % Turn plot visibility off.
    data.YPlot.Visible = "off";
    data.YPlotDot.Visible = "off";
    data.PredictedAnnotation.Visible = "off";

    % Set the current predicted sound class to silence and color-code as
    % black.
    pClass = "Silence";
    pcol = "k";
end

% Update the annotation strings and color code them.
if isequal(tcol,pcol)
    col = 'b';
else
    col = 'r';
end
data.GTAnnotation.String = gtClass;
data.GTAnnotation.Color = col;
data.PredictedAnnotation.String = pClass;
data.PredictedAnnotation.Color = col;

drawnow
end
Plot 4D
function plot4d(audioToPlay,sedLabels,doaLabels,sed,doa)
%PLOT4D Plot 4D
% plot4d(audioToPlay,sedLabels,doaLabels,sed,doa) creates a "movie" of
% ground truth and estimated sound events in a 3-D environment over time.
% The movie runs in real time and plays the audioToPlay to your default
% sound device.

% Create an audioDeviceWriter object to play streaming audio.
adw = audioDeviceWriter(SampleRate=32e3);

% Create and fill a dsp.AsyncBuffer to read chunks of audio data.
buff = dsp.AsyncBuffer(size(audioToPlay,1));
write(buff,audioToPlay);

% Create a 3-D plot without a slider.
data = plot3d(sedLabels,doaLabels,sed,doa,IncludeSlider=false);

drawnow

% The true and predicted label definitions have resolutions of 0.1 seconds. Create a
% labels vector to only update the 3-D plot when necessary.
changepoints = 0.1:0.1:60;

% Initialize counters.
idx = 1;
elapsedTime = 0;

% Loop while audio data is unread.
while buff.NumUnreadSamples~=0

    % Update a plot if a changepoint is reached.
    if elapsedTime>changepoints(idx)
        update3DPlot(idx/600,data)
        idx = idx+1;
    end

    % Write a chunk of data to your sound card.
    adw(read(buff,400));

    % Push the elapsed time forward.
    elapsedTime = elapsedTime + 400/32e3;
end

end
Get Colors
function colors = getColors()
%GETCOLORS Get colors
% colors = getColors() returns a cell array of 14 unique colors.

% Define 14 colors to color-code the sound classes.
colors = {[0,0.4470,0.7410],[0.8500,0.3250,0.0980],[0.9290,0.6940,0.1250],[0.4940,0.1840,0.5560], ...
    [0.4660 0.6740 0.1880],[0.3010 0.7450 0.9330],[0.6350 0.0780 0.1840],[0.2,1,1],[0.6,0,0.6], ...
    [0.6,0.6,0],[0.6,0.3,0],[0,0.4,0.2],[0.2,0,0.4],[1,0.6,0.6]};
end
Get Sound Classes
function soundClasses = getSoundClasses()
%GETSOUNDCLASSES Get map between sound classes (keys) and values.

soundClasses = categorical(["Silence","Clink","Keyboard","Cupboard","Drawer","Female","Fingers Snap", ...
    "Keys","Knock","Laughter","Male","Printer","Scissors","Telephone","Writing"]);
end
References
[1] Sharath Adavanne, Archontis Politis, Joonas Nikunen, and Tuomas Virtanen, "Sound event localization and detection of overlapping sources using convolutional recurrent neural networks," IEEE J. Sel. Top. Signal Process., vol. 13, no. 1, pp. 34-48, 2019.
[2] Eric Guizzo, Riccardo F. Gramaccioni, Saeid Jamili, Christian Marinoni, Edoardo Massaro, Claudia Medaglia, Giuseppe Nachira, Leonardo Nucciarelli, Ludovica Paglialunga, Marco Pennese, Sveva Pepe, Enrico Rocchi, Aurelio Uncini, and Danilo Comminiello "L3DAS21 Challenge: Machine Learning for 3D Audio Signal Processing," 2021.
[3] Yin Cao, Qiuqiang Kong, Turab Iqbal, Fengyan An, Wenwu Wang, and Mark D. Plumbley, "Polyphonic sound event detection and localization using a two-stage strategy," arXiv preprint: arXiv:1905.00268v4, 2019.