Published
Color correction with a parula quilt
My wife, Geri Eddins, has been making a lot of quilts lately. A few months ago, I printed out these 10 colors, showed them...
7 years ago

Published
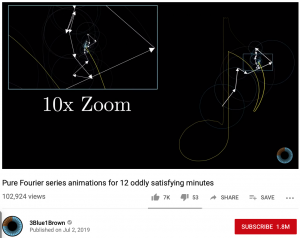
Fourier series and Hilbert curve animations
In a complete coincidence, two different coworkers today sent me links to two different works of 3Blue1Brown on YouTube. I...
7 years ago
Published
pixelgrid
ContentsIntroductionFind the image objectGet the spatial coordinates for drawing the outlineConstruct the x- and...
7 years ago
Published
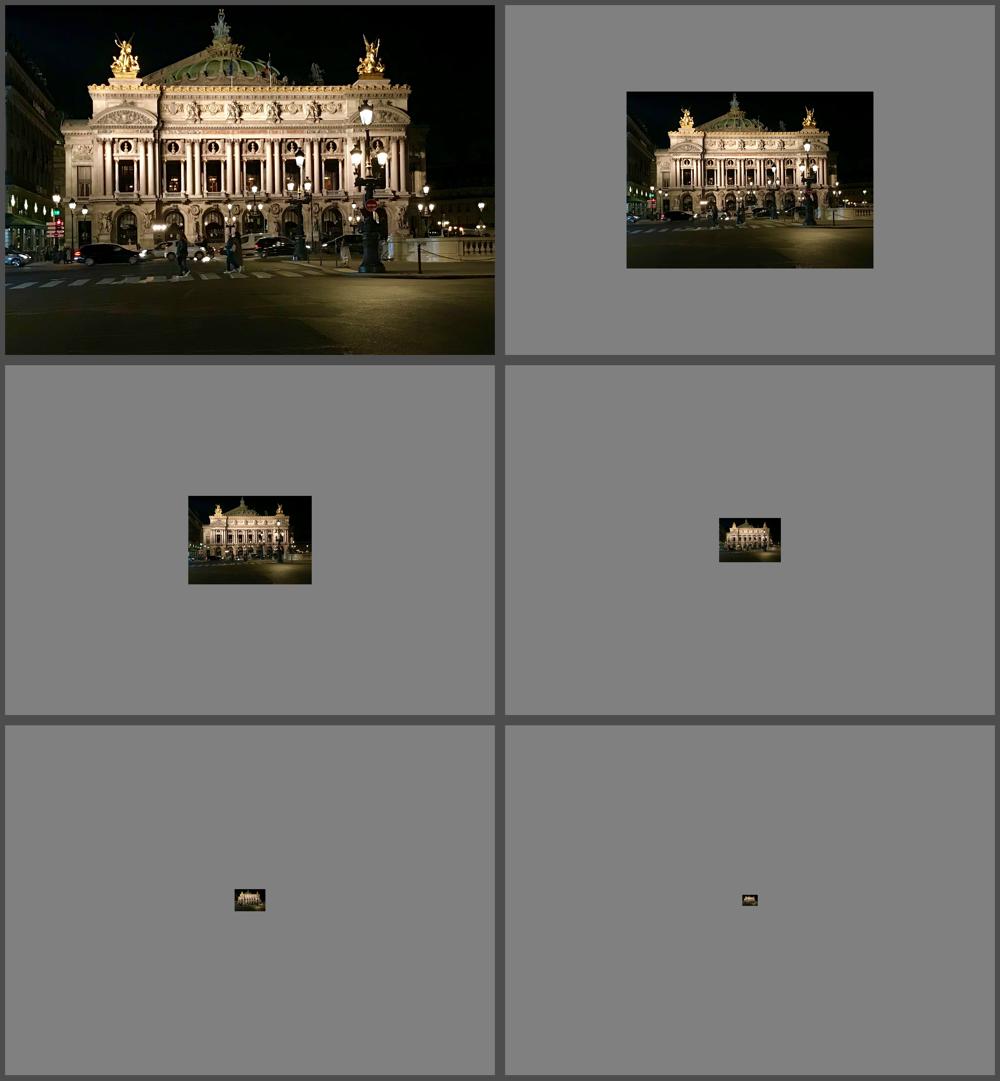
Multiresolution pyramids part 4: Image blending
Today I want to wrap up (for now) my series on multiresolution pyramids by showing you how to make this strange-looking...
7 years ago
Published
Changes to SUM and DIM
Does this line of code make you raise your eyebrows in puzzlement?c = sum(A,[1 2]) If so, you are likely an experienced...
7 years ago

Published
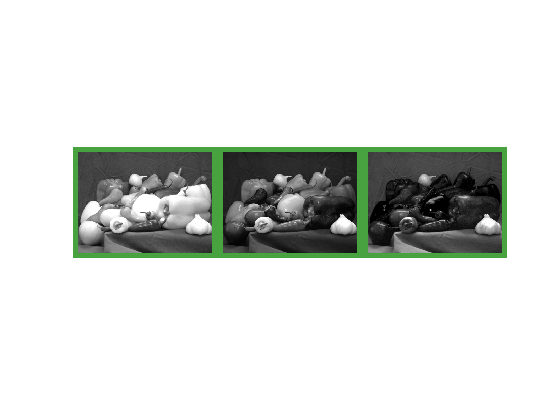
Multiresolution pyramids part 3: Laplacian pyramids
In my April 2 post, I introduced multiresolution pyramids, and I explained my dissatisfaction with the function impyramid,...
7 years ago

Published
Multiresolution image pyramids and impyramid – part 2
Last time, I talked about the function impyramid and how I have been dissatisfied with it. (Confession: I designed it.)...
7 years ago
Published
Multiresolution image pyramids and impyramid – part 1
There's a function in the Image Processing Toolbox that I'm not especially fond of: impyramid.I shouldn't tell you who...
7 years ago
Published
A new image tiling function in MATLAB
I was noodling around recently with a future blog topic (multiresolution pyramids; stay tuned) when I was reminded of a...
7 years ago
Published
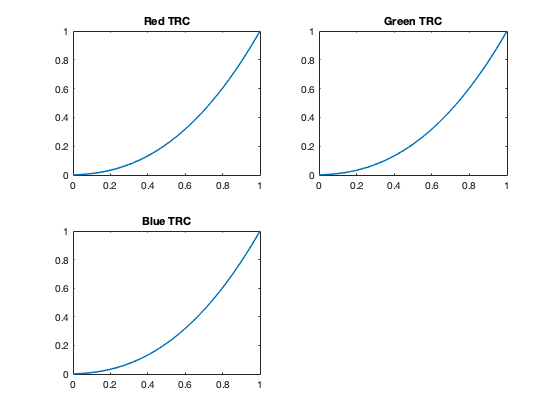
Converting from sRGB to SWOP CMYK
An Image Processing Toolbox user recently reported to us good results for using makecform and applycform to convert colors...
7 years ago
Published
Making your plot lines thicker
Today's blog post is dedicated to everyone whose eyes aren't as young as they used to be.In last week's blog post on pursuit...
7 years ago

Published
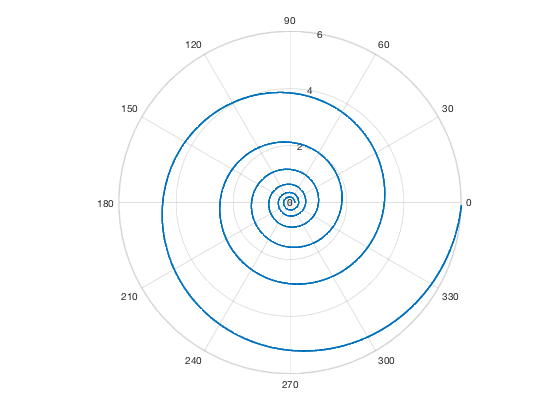
Pursuit Curves
Here's an interesting snippet I learned while working on today's blog post: Mathematician Jacob Bernoulli asked for a...
7 years ago
Published
Animated PNG (APNG) Files
Update: See my 20-Dec-2019 post for how to write APNG files from MATLAB. Have you heard of animated PNG (APNG)...
7 years ago
Published
Deep Beer Designer
This post is from Ieuan Evans, who has created a very unique example combining deep learning with LSTM and beer. (Please...
7 years ago

Published
3 Trends in Deep Learning
And how MATLAB helps you take advantage of them. Last post*, Steve Eddins wrote about some of the new features in the...
7 years ago

Published
Deep Learning with MATLAB R2018b
Note: This will be my last regular post for the Deep Learning blog. Johanna Pingel will be taking over for me. You have...
7 years ago
Published
Deep Learning in Action – part 3
Hello Everyone! It's Johanna, and Steve has allowed me to take over the blog from time to time to talk about deep...
8 years ago

Published
Classify EEG Signals Using LSTM Networks
Today I want to highlight a signal processing application of deep learning. This example, which is from the Signal...
8 years ago

Published
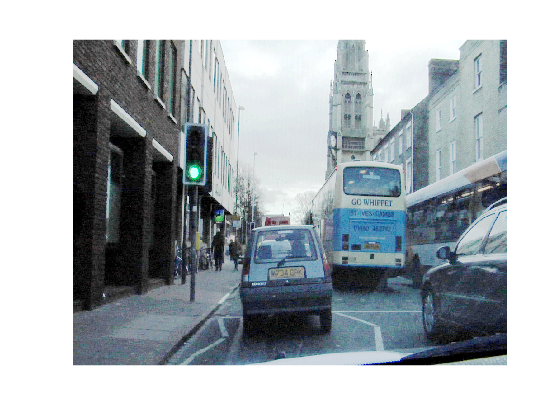
Semantic Segmentation Using Deep Learning
Today I want to show you a documentation example that shows how to train a semantic segmentation network using deep learning...
8 years ago
Published
Superpixel Posterization
Today's blog post was inspired by an example written by my friend and Image Processing Toolbox developer, Alex Taylor. A few...
8 years ago
Published
Feret Properties – Wrapping Up
Today I want to finish up my long-running discussion of Feret diameters. (Previous posts: 29-Sep-2017, 24-Oct-2017,...
8 years ago
Published
What is the Shape of a Pixel?
ContentsThe Shape of a PixelWeaknesses of Using the Pixel CentersSquare PixelsDiamond PixelsCircular PixelsThe Shape of a...
8 years ago
Published
Minimum Feret Diameter
Last time (if you can remember that long ago), I talked about how to find the maximum Feret diameter of a shape. The Feret...
8 years ago

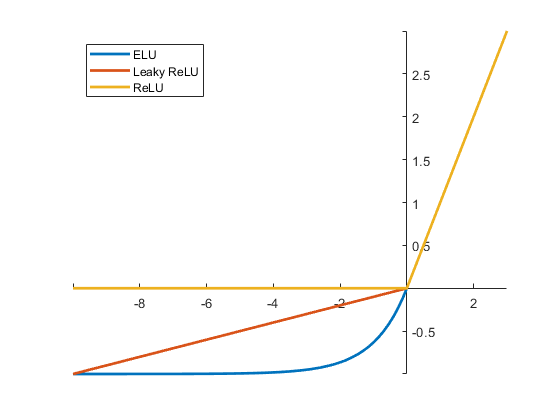
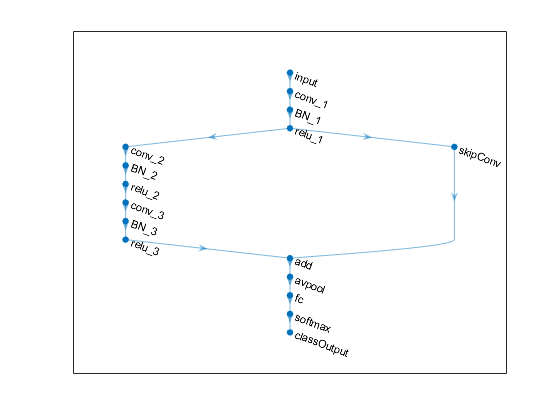
Published
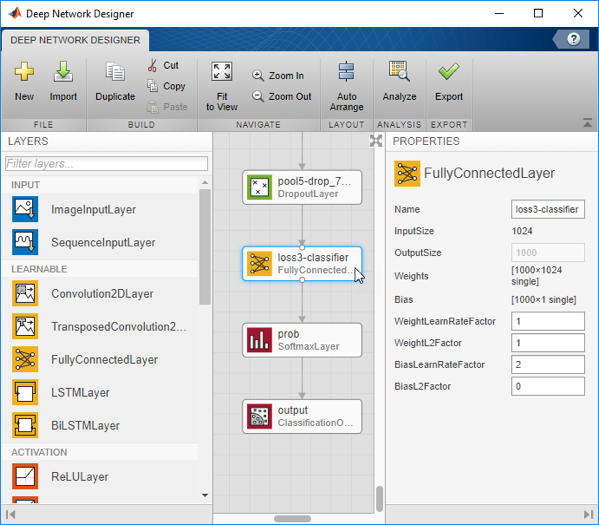
Defining Your Own Network Layer
Note: Post updated 27-Sep-2018 to correct a typo in the implementation of the backward function. One of the new Neural...
8 years ago
Published
Feret Diameters and Antipodal Vertices
Last time, I wrote about finding the maximum Feret diameter for an object in a binary image, ending up with this figure: I...
8 years ago

Published
Deep Learning with MATLAB R2017b
The R2017b release of MathWorks products shipped just two weeks ago, and it includes many new capabilities for deep...
8 years ago
Published
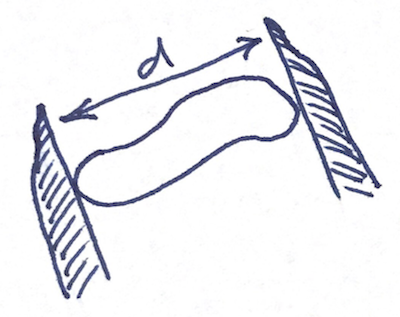
Feret Diameter: Introduction
This is the first of a few blog posts about object measurements based on a concept called the Feret diameter, sometimes...
8 years ago
Published
New Deep Learning Blog on MATLAB Central
I'd like to invite everyone to check out the new Deep Learning blog that just launched today on MATLAB Central. I...
8 years ago
Published
Jumping into the Deep End
Hello, and welcome to the new MATLAB Central blog on deep learning! In my 24th year of MATLAB and toolbox development and...
8 years ago

Published
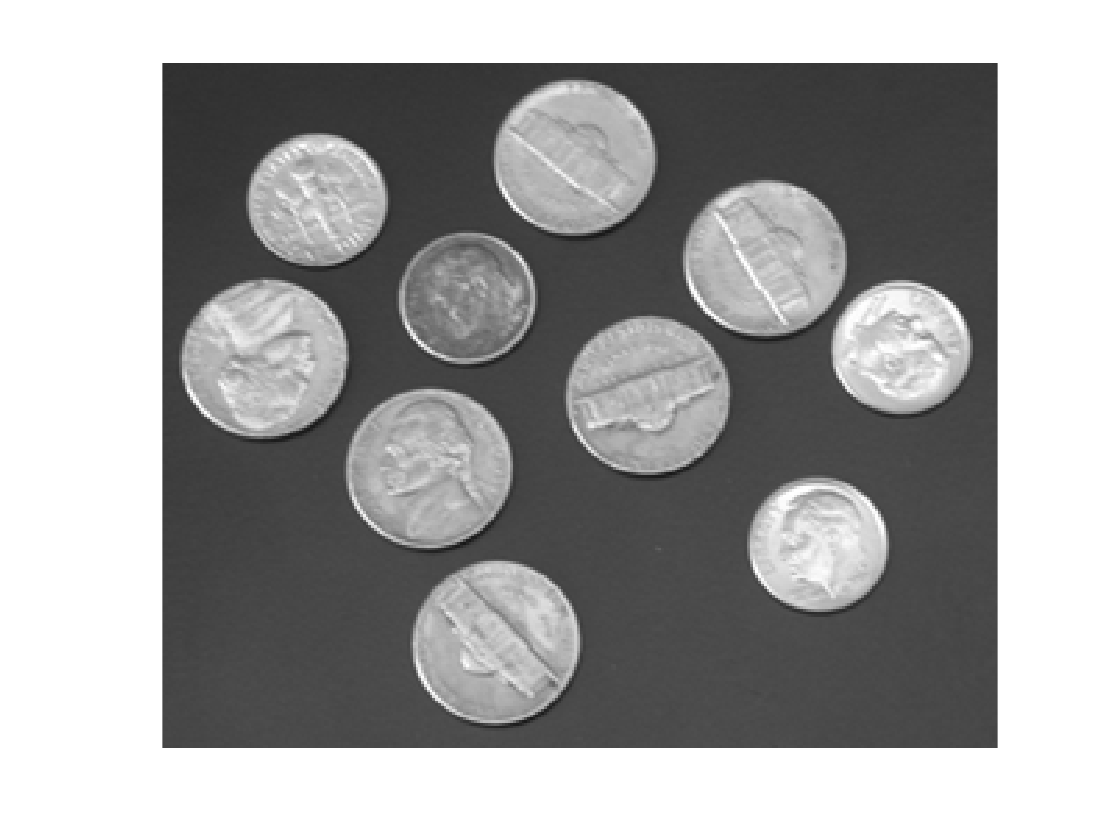
Gray-scale pixel values in image regions
Before I dive into today's topic, I want to invite you to come back to the MATLAB Central Blogs page in a couple of weeks....
8 years ago