Results for
どの方法を使う事が多いですか?他によく使う方法があれば教えてくださいー。
方法①
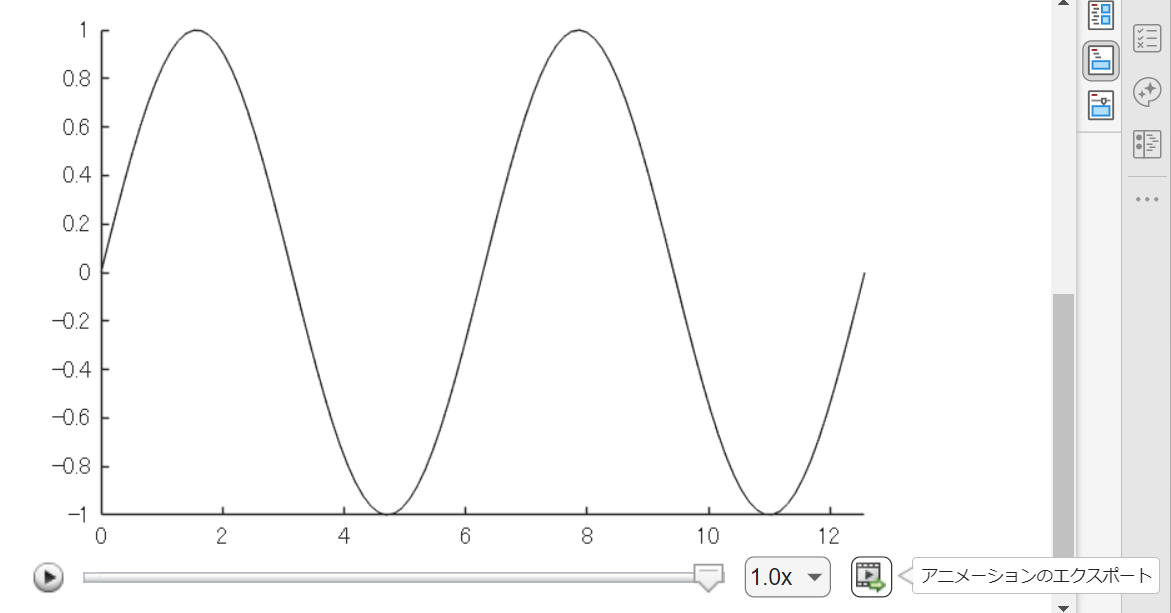
Livescript 上で for ループ内で描画を編集させて描いた動画は「アニメーションのエクスポート」から動画ファイルに出力するのが一番簡単ですね。再生速度やら細かい設定ができない点は要注意。
方法②
exportgraphics 関数で "Append" オプション指定で実現できるようになった(R2022a から)のでこれも便利ですね。
N = 100;
x = linspace(0,4*pi,N);
y = sin(x);
filename = 'animation_sample.gif'; % Specify the output file name
if exist(filename,'file')
delete(filename)
end
h = animatedline;
axis([0,4*pi,-1,1]) % x軸の表示範囲を固定
for k = 1:length(x)
addpoints(h,x(k),y(k)); % ループでデータを追加
exportgraphics(gca,filename,"Append",true)
end
方法③
R2021b 以前のバージョンだとこんな感じ。
各ループで画面キャプチャして、imwrite で動画ファイルにフレーム追加していくイメージです。"DelayTime" を使って細かい指定ができるので、必要に応じて今でも利用します。
for k = 1:length(x)
addpoints(h,x(k),y(k)); % ループでデータを追加
drawnow % グラフアップデート
frame = getframe(gcf); % Figure 画面をムービーフレーム(構造体)としてキャプチャ
tmp = frame2im(frame); % 画像に変更
[A,map] = rgb2ind(tmp,256); % RGB -> インデックス画像に
if k == 1 % 新規 gif ファイル作成
imwrite(A,map,filename,'gif','LoopCount',Inf,'DelayTime',0.2);
else % 以降、画像をアペンド
imwrite(A,map,filename,'gif','WriteMode','append','DelayTime',0.2);
end
end
これからは生成AIでコードを1から書くという事が減ってくるのかと思いますが,皆さんがMATLABのコードを書く時に意識しているご自身のルールのようなものがあれば教えてください.
MATLAB言語は柔軟に書けますが,自然と個人個人のルールというものが出来上がってきているのでは,と思います.
私はParameter, Valueペアの引数がある関数はそれぞれのペアを新しい行に書く,というのをよくやります.
h = plot(x, y, "ro-", ...
"LineWidth", 2, ...
"MarkerSize", 10, ...
"MarkerFaceColor", "g");
Parameter=Valueでも同じです.
h = plot(x, y, "ro-", ...
LineWidth = 2, ...
MarkerSize = 10, ...
MarkerFaceColor = "g");
また,一時期は "=" を揃えることもやってました(今はやってませんが).
h = plot(x, y, "ro-", ...
LineWidth = 2, ...
MarkerSize = 10, ...
MarkerFaceColor = "g");
皆さんにはどのようなルールがありますか?
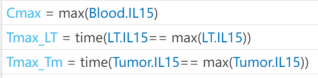
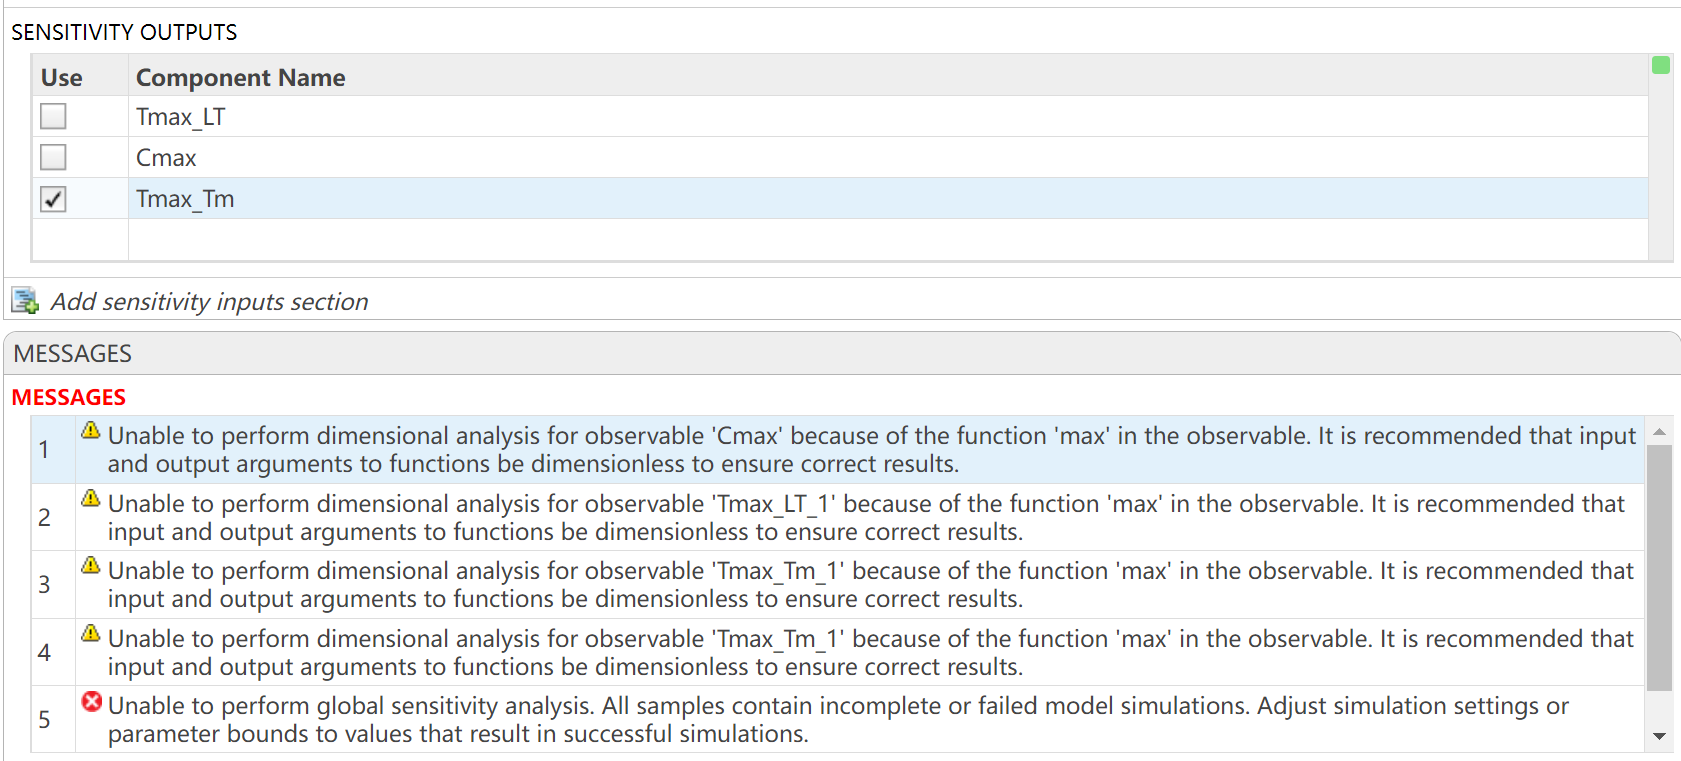
I want to observe the time (Tmax) to reach maximum drug concentration (Cmax) in my model. I have set up the OBSERVABLES as follows (figure1): Cmax = max(Blood.lL15); Tmax_LT = time(Conc_lL15_LT_nm == max(Conc_lL15_LT_nm)); Tmax_Tm = time(Conc_lL15_Tumor_nm == max(Conc_lL15_Tumor_nm)); After running the Sobol indices program for global sensitivity analysis, with inputs being some parameters and their ranges, the output for Cmax works, but there are some prompts, as shown in figure2. Additionally, when outputting Tmax, the program does not run successfully and reports some errors, as shown in figure2. How can I resolve the errors when outputting Tmax?
Bom dia se alguém puder me ajudar, meu código abaixo, não estou conseguintdo conectar o meu Esp8266 ao ThingSpeak, o erro tá na conexão. Estou usando o MicroPython e NodeMCU na plataforma Pytohn o sistema operacional Ubuntu 20
# DHT11 -> ESP8266/ESP32
# 1(Vcc) -> 3v3
# 2(Data) -> GPIO12
# 4(Gnd) -> Gnd
import time, network, machine
from dht import DHT11
from machine import Pin
from umqtt.simple import MQTTClient
print("Iniciando...")
dht = DHT11(Pin(12, Pin.IN, Pin.PULL_UP))
estacao = network.WLAN(network.STA_IF)
estacao.active(True)
estacao.connect('xxxxxxx', 'xxxxxxxxx')
while estacao.isconnected() == False:
machine.idle()
print('Conexao realizada.')
print(estacao.ifconfig())
SERVIDOR = "mqtt.thingspeak.com"
CHANNEL_ID = "XXXXXXXXXXXXXXXXX"
WRITE_API_KEY = "XXXXXXXXXXXXXXXXXXXXX"
topico = "channels/" + CHANNEL_ID + "/publish/" + WRITE_API_KEY
cliente = MQTTClient("umqtt_client", SERVIDOR)
try:
while True:
dht.measure()
temp = dht.temperature()
umid = dht.humidity()
print('Temperatura: %3.1f °C' %temp)
print('Umidade: %3.1f %%' %umid)
conteudo = "field1=" + str(temp) + "&field2=" + str(umid)
print ('Conectando a ThingSpeak...')
cliente.connect()
cliente.publish(topico, conteudo)
cliente.disconnect()
print ('Envio realizado.')
time.sleep(600.0)
except KeyboardInterrupt:
estacao.disconnect()
estacao.active(False)
print("Fim.")
*****************************************************************************************************
No shell aparece como resposta:
MPY: soft reboot
Iniciando...
Conexao realizada.
('192.168.0.23', '255.255.255.0', '192.168.0.1', '8.8.8.8')
Temperatura: 29.0 °C
Umidade: 63.0 %
Conectando a ThingSpeak...
Traceback (most recent call last):
File "<stdin>", line 38, in <module>
File "umqtt/simple.py", line 67, in connect
OSError: -2
linha 38 é cliente.connect()
w = logspace(-1,3,100);
[m,p] = bode(tf(1,[1 1]),w);
size(m)
and therefore plotting requires an explicit squeeze (or rehape, or colon)
% semilogx(w,squeeze(db(m)))
Similarly, I'm using page* functions more regularly and am now generating 3D results whereas my old code would generate 2D. For example
x = [1;1];
theta = reshape(0:.1:2*pi,1,1,[]);
Z = [cos(theta), sin(theta);-sin(theta),cos(theta)];
y = pagemtimes(Z,x);
Now, plotting requires squeezing the inputs
% plot(squeeze(theta),squeeze(y))
Would there be any drawbacks to having plot, et. al., automagically apply squeeze to its inputs?
昨日 5/29 にお台場で MATLAB EXPO が開催されました。ご参加くださった方々ありがとうございました!
私は AI 関連のデモ展示で解説員としても立っておりましたが、立ち寄ってくださる方が絶えず、ずっと喋り続けてました。また、講演後に「さっきのすごくね?」という会話が漏れ聞こえてきたのがハイライト。
参加されたみなさま、印象に残ったこと・気になった講演・ポスター・デモ・新機能等あったら教えてください!(次回に向けて運営面での感想も)

The ability to plot multiple signals on a plot and then use the plot browser to interactively control which ones are displayed has been one of the most useful features of the plotting tools and many of my scripts embed the command to open it after results analysis and plotting. It's been removed in 2025A with the comment that the Property Inspector provides the alternative. It doesn't. Having to go back into the menu to select the plot edit features to get to the Property Inspector (which doesn't provide an efficient alternative to the plot browser) has made the workflow very inefficient. Please bring it back a.s.a.p. !!!!
I want to use Simulink for model-based development of the TC3XX series development board, but I am not sure about the development process and toolchain? Is there a free toolchain available for me to use? Do you have a detailed development tutorial?
以前のEXPOでも参加・聴講したことがある
67%
知り合いから聞いた
0%
MathWorksからのプロモーション,EXPOサイトで知った
0%
今年のEXPO会場でたまたま見かけた
0%
ライトニングトークって何?
33%
3 votes
I have a pressure vs. time plot resulting from the input of an elastic wave, which I obtained from an Abaqus simulation. So, I have access to all the data. Now, I want to convert this time-domain graph into a frequency-domain graph using FFT in MATLAB.
I came across a code through ChatGPT, but I’m not fully confident in relying on it. Could anyone kindly clarify whether the formulas used for FFT in MATLAB are universal for all types of signals? Or is there a more effective and reliable method I should consider for this purpose?
Hi guys!
Im doing a project where i need to simulate a ship connected to the grid. I have a grid->converter AC-DC-AC -> dynamic load. My converter has to keep the voltage consistent and what changes is the current. Can somebody help me?
I like this problem by James and have solved it in several ways. A solution by Natalie impressed me and introduced me to a new function conv2. However, it occured to me that the numerous test for the problem only cover cases of square matrices. My original solutions, and Natalie's, did niot work on rectangular matrices. I have now produced a solution which works on rectangular matrices. Thanks for this thought provoking problem James.
Large Languge model with MATLAB, a free add-on that lets you access LLMs from OpenAI, Azure, amd Ollama (to use local models) on MATLAB, has been updated to support OpenAI GPT-4.1, GPT-4.1 mini, and GPT-4.1 nano.
According to OpenAI, "These models outperform GPT‑4o and GPT‑4o mini across the board, with major gains in coding and instruction following. They also have larger context windows—supporting up to 1 million tokens of context—and are able to better use that context with improved long-context comprehension."
What would you build with the latest update?

Provide insightful answers
9%
Provide label-AI answer
9%
Provide answer by both AI and human
21%
Do not use AI for answers
46%
Give a button "chat with copilot"
10%
use AI to draft better qustions
5%
1561 votes
I have written, tested, and prepared a function with four subsunctions on my computer for solving one of the problems in the list of Cody problems in MathWorks in three days. Today, when I wanted to upload or copy paste the codes of the function and its subfunctions to the specified place of the problem of Cody page, I do not see a place to upload it, and the ability to copy past the codes. The total of the entire codes and their documentations is about 600 lines, which means that I cannot and it is not worth it to retype all of them in the relevent Cody environment after spending a few days. I would appreciate your guidance on how to enter the prepared codes to the desired environment in Cody.
I've long used the Tensor Toolbox from Sandia in order to use tensors in Matlab, but recently found myself wanting to apply it on symbolic arguments, which don't appear supported. Some google-fu'ing resulted in (non-free) Tensorlab and some file-exchange entries of mixed quality. And of course, there's the recent tensorprod, which a) doesn't support symbolics and b) arguments aren't strictly tensors (rather "representations of tensors in a matrix type").
This all got me to thinking that it would be mighty nice to have general / native / comprehensive support for a tensor class in official Matlab - even if it were in a separate toolbox.
%% 清理环境
close all; clear; clc;
%% 模拟时间序列
t = linspace(0,12,200); % 时间从 0 到 12,分 200 个点
% 下面构造一些模拟的"峰状"数据,用于演示
% 你可以根据需要替换成自己的真实数据
rng(0); % 固定随机种子,方便复现
baseIntensity = -20; % 强度基线(z 轴的最低值)
numSamples = 5; % 样本数量
yOffsets = linspace(20,140,numSamples); % 不同样本在 y 轴上的偏移
colors = [ ...
0.8 0.2 0.2; % 红
0.2 0.8 0.2; % 绿
0.2 0.2 0.8; % 蓝
0.9 0.7 0.2; % 金黄
0.6 0.4 0.7]; % 紫
% 构造一些带多个峰的模拟数据
dataMatrix = zeros(numSamples, length(t));
for i = 1:numSamples
% 随机峰参数
peakPositions = randperm(length(t),3); % 三个峰位置
intensities = zeros(size(t));
for pk = 1:3
center = peakPositions(pk);
width = 10 + 10*rand; % 峰宽
height = 100 + 50*rand; % 峰高
% 高斯峰
intensities = intensities + height*exp(-((1:length(t))-center).^2/(2*width^2));
end
% 再加一些小随机扰动
intensities = intensities + 10*randn(size(t));
dataMatrix(i,:) = intensities;
end
%% 开始绘图
figure('Color','w','Position',[100 100 800 600],'Theme','light');
hold on; box on; grid on;
for i = 1:numSamples
% 构造 fill3 的多边形顶点
xPatch = [t, fliplr(t)];
yPatch = [yOffsets(i)*ones(size(t)), fliplr(yOffsets(i)*ones(size(t)))];
zPatch = [dataMatrix(i,:), baseIntensity*ones(size(t))];
% 使用 fill3 填充面积
hFill = fill3(xPatch, yPatch, zPatch, colors(i,:));
set(hFill,'FaceAlpha',0.8,'EdgeColor','none'); % 调整透明度、去除边框
% 在每条曲线尾部标注 Sample i
text(t(end)+0.3, yOffsets(i), dataMatrix(i,end), ...
['Sample ' num2str(i)], 'FontSize',10, ...
'HorizontalAlignment','left','VerticalAlignment','middle');
end
%% 坐标轴与视角设置
xlim([0 12]);
ylim([0 160]);
zlim([-20 350]);
xlabel('Time (sec)','FontWeight','bold');
ylabel('Frequency (Hz)','FontWeight','bold');
zlabel('Intensity','FontWeight','bold');
% 设置刻度(根据需要微调)
set(gca,'XTick',0:2:12, ...
'YTick',0:40:160, ...
'ZTick',-20:40:200);
% 设置视角(az = 水平旋转,el = 垂直旋转)
view([211 21]);
% 让三维坐标轴在后方
set(gca,'Projection','perspective');
% 如果想去掉默认的坐标轴线,也可以尝试
% set(gca,'BoxStyle','full','LineWidth',1.2);
%% 可选:在后方添加一个浅色网格平面 (示例)
% 这个与题图右上方的网格类似
[Xplane,Yplane] = meshgrid([0 12],[0 160]);
Zplane = baseIntensity*ones(size(Xplane)); % 在 Z = -20 处画一个竖直面的框
surf(Xplane, Yplane, Zplane, ...
'FaceColor',[0.95 0.95 0.9], ...
'EdgeColor','k','FaceAlpha',0.3);
%% 进一步美化(可根据需求调整)
title('3D Stacked Plot Example','FontSize',12);
constantplane("x",12,FaceColor=rand(1,3),FaceAlpha=0.5);
constantplane("y",0,FaceColor=rand(1,3),FaceAlpha=0.5);
constantplane("z",-19,FaceColor=rand(1,3),FaceAlpha=0.5);
hold off;

Have fun! Enjoy yourself!
We are excited to announce the first edition of the MathWorks AI Challenge. You’re invited to submit innovative solutions to challenges in the field of artificial intelligence. Choose a project from our curated list and submit your solution for a chance to win up to $1,000 (USD). Showcase your creativity and contribute to the advancement of AI technology.