Wideband Spectrum Analysis
This example shows how to capture a wideband signal from the air using a software-defined radio (SDR) and then analyze the data using the Signal Analyzer app.
Set Up Radio
Call the radioConfigurations function. The function returns all available radio setup configurations that you saved using the Radio Setup wizard.
savedRadioConfigurations = radioConfigurations;
To add the names of your radio setup configurations to the menu options, click Update. Then select the radio to use with this example.
savedRadioConfigurationNames = [string({savedRadioConfigurations.Name})];
radio = savedRadioConfigurationNames(1) ;
;Configure Baseband Receiver
Create a basebandReceiver object with the specified radio. Because the object requires exclusive access to radio hardware resources, before running this example for the first time, clear any other object associated with the specified radio. To speed up the execution time of the example in subsequent runs, reuse your new workspace object.
if ~exist("bbrx","var")
    bbrx = basebandReceiver(radio);
end
Set the baseband receiver object properties to capture the signal of interest.
maxSampleRate = hMaxSampleRate(radio); bbrx.SampleRate =maxSampleRate; bbrx.RadioGain =
30;
To update the menu with the antennas available for your radio, call the hCaptureAntennas helper function. Then select the antenna to use with this example.
antennaSelection = hCaptureAntennas(radio);
bbrx.Antennas = antennaSelection(1);
Capture Signal
To capture a signal, call the capture function on the baseband receiver object. Specify the length of the capture and the center frequency.
bbrx.CenterFrequency =2400000000; captureLength = milliseconds(
50); [data,timestamp] = capture(bbrx,captureLength);
Analyze Captured Signal
To analyze the captured signal in the time, frequency, or time-frequency domains, open the Signal Analyzer app, specifying the captured data as an input argument. With the app, you can visualize and compare multiple signals, plot the signal spectrum, measure signal statistics, or manipulate the data with techniques such as smoothing, filtering, resampling, or region extraction.
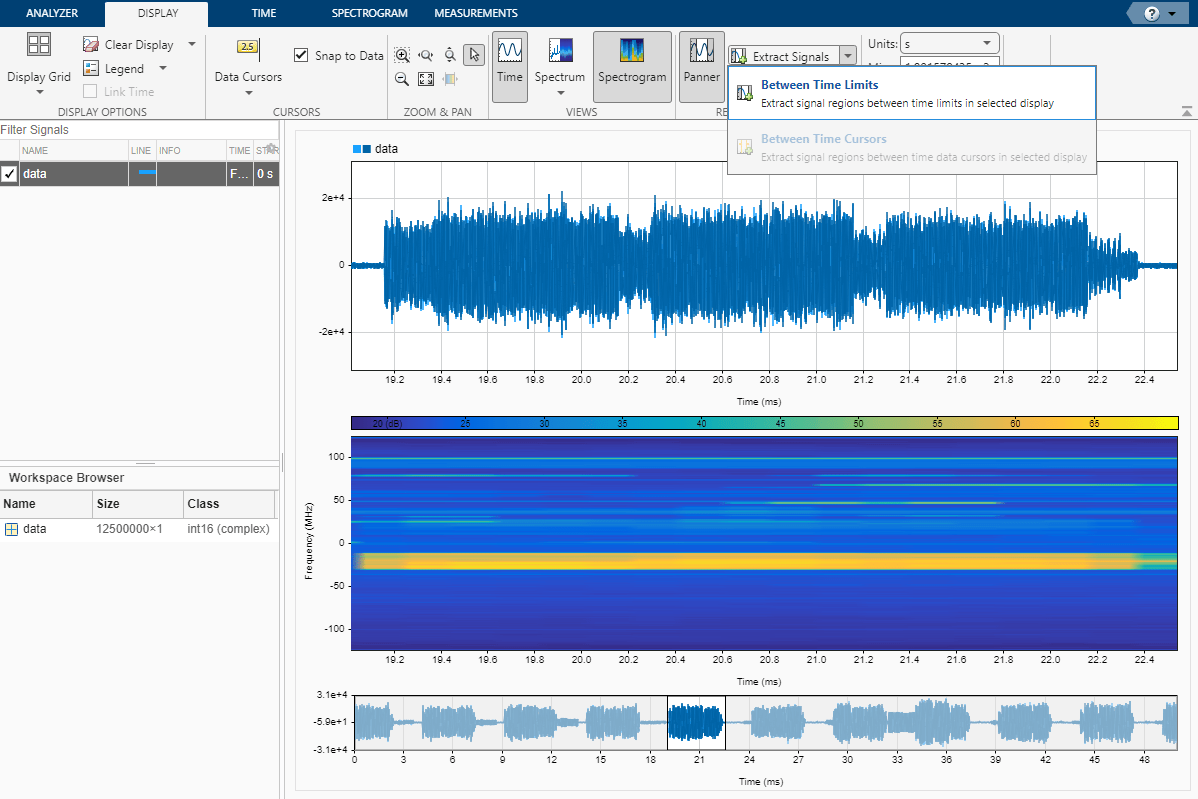
Open the Signal Analyzer app with the captured data.
signalAnalyzer(data,'SampleRate',bbrx.SampleRate);Here, the Signal Analyzer app shows a time and spectrogram plot of data captured for a duration of 50 ms at a 250 MHz sampling rate and a center frequency of 2.4 GHz. You can see bursty WLAN data in the plot.

To compare multiple captures, include additional signals from the workspace. To select a region of interest for extraction, use the Panner tool.