2-D Standard Deviation
Compute standard deviation of input or sequence of inputs

Libraries:
Computer Vision Toolbox /
Statistics
Description
The 2-D Standard Deviation block computes the standard deviation of an input array. The input can be a 1-D vector, 2-D matrix, or an N-D-array. The block can compute standard deviation along a specified dimension of the input or the entire input. If you select the Running standard deviation parameter, the block can also track the standard deviation in a sequence of inputs over a time period.
Examples
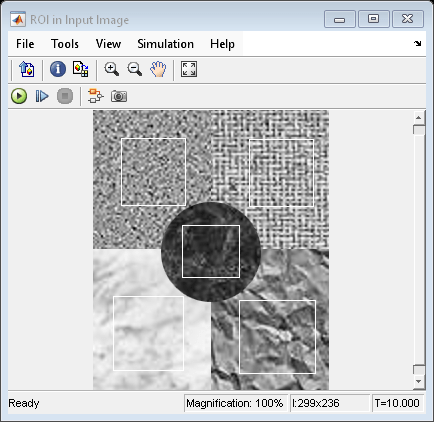
Compute Standard Deviation of ROIs
Compute the standard deviation of regions-of-interest (ROIs) in the input image. The input image is composed of different texture regions and ROIs are selected to contain these texture regions.
Ports
Input
Output
Parameters
Main Tab
Select to track the standard deviation of successive inputs to the block. In this mode, the block treats each element as a channel.
Specify when the block detects a reset event. The block resets the running standard deviation when a reset event is detected at the optional Rst port. The reset sample time must be a positive integer and a multiple of the input sample time.
Specify the reset event as:
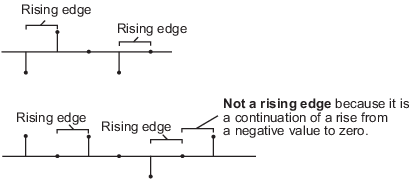
Noneto disable the Rst port.Rising edgeto trigger a reset event when the Rst input does one of the following:Rises from a negative value to either a positive value or zero
Rises from zero to a positive value, where the rise is not a continuation of a rise from a negative value to zero
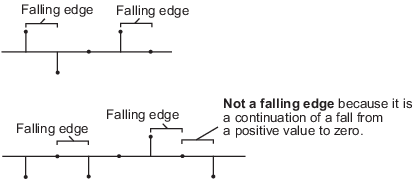
Falling edgeto trigger a reset event when the Rst input does one of the following:Falls from a positive value to either a negative value or zero
Falls from zero to a negative value, where the fall is not a continuation of a fall from a positive value to zero
Either edgeto trigger a reset event when the Rst input is aRising edgeorFalling edge.Non-zero sampleto trigger a reset event at each sample time, when the Rst input is not zero.Note
When running simulations in the Simulink® multitasking mode, reset signals have a one-sample latency. Therefore, when the block detects a reset event, there is a one-sample delay at the reset port rate before the block applies the reset.
Dependencies
To enable this parameter, select the Running standard deviation parameter.
Specify the dimension of the input along which the block computes the standard deviation.
Entire input— Computes standard deviation over the entire input.Each row— Computes standard deviation over each row.Each column— Computes standard deviation over each column.Specified dimension— Computes standard deviation over the dimension specified in the Dimension parameter. By default, the Dimension parameter is set to 1 and the output is the same as when you selectEach column.
Dependencies
To enable this parameter, clear the Running standard deviation parameter.
Specify the dimension of the input array over which the standard deviation is computed as a one-based value. The value of this parameter is set to 1..
Dependencies
To enable this parameter, set the Find the standard deviation value
over parameter to Specified dimension.
ROI Processing
Select to calculate standard deviation within a particular ROI in the image.
Note
Full ROI processing is available only if you have a Computer Vision Toolbox™ license. If you do not have a Computer Vision Toolbox license, you can still use ROI processing, but the ROI
type is limited to Rectangles.
Dependencies
To enable this parameter, set the Find the standard deviation value
over parameter to Entire input.
Specify the type of ROI that represents the regions in the image over which the block computes the standard deviation. The type of ROI can be a rectangle, line, label matrix, or a binary mask.
| Parameters | Description | |
| ROI type | Inputs to the ROI port | |
Rectangles |
|
|
Lines |
|
|
Label matrix | M-by-N matrix | Matrix of the same size as the input image. The matrix contains label values that represent different objects in an image. The pixels labeled 0 are the background. The pixels labeled 1 make up one object; the pixels labeled 2 make up a second object; and so on. |
Binary mask | M-by-N matrix | Matrix of the same size as the input image. The binary mask classifies image pixels as belonging to either the region of interest or the background. The mask pixel values of 1 indicate that the image pixel belongs to the ROI. The mask pixel values of 0 indicate that the image pixel is part of the background. |
Dependencies
To enable this parameter, select the Enable ROI processing parameter.
Specify the portion of the ROI from which the block has to calculate 2-D standard deviation. The ROI portion is either the entire ROI or the ROI perimeter.
Dependencies
To enable this parameter, select the Enable ROI processing
parameter and set the ROI type parameter to
Rectangles.
Specify whether to calculate 2-D standard deviation individually for each ROI or for the entire ROI.
If you select
Individual statistics for each ROI, the block outputs a vector of standard deviation values. The size of the output vector is equal to the number of ROIs.If you select
Single statistic for all ROIs, the block outputs a scalar value. The scalar value represents the statistical value for all the specified ROIs.
Dependencies
To enable this parameter, select the Enable ROI processing
parameter and set the ROI type parameter to
Rectangles, Lines, or
Label matrix.
Select to expose the Flag port. For a description of the Flag port output, see Flag.
Dependencies
To enable this parameter, select the Enable ROI processing
parameter and set the ROI type parameter to
Rectangles, Lines, or
Label matrix.
Data Types Tab
For details on the fixed-point block parameters, see Specify Fixed-Point Attributes for Blocks (DSP System Toolbox).
Select this parameter to prevent the fixed-point tools from overriding the data types you specify in this block. For more information, see Lock the Output Data Type Setting (Fixed-Point Designer).
Block Characteristics
Data Types |
|
Multidimensional Signals |
|
Variable-Size Signals |
|
Extended Capabilities
Version History
Introduced in R2011b
See Also
2-D
Mean | var | 2-D
Variance