Plot the MACD Indicator
This example shows how to construct a timetable and plot the moving average convergence/divergence (MACD) indicator. The MACD is a trading indicator used in the technical analysis of stock prices. The MACD provides an indication of whether to buy or sell a stock, when an overbought or oversold condition is occurring, and when the end of a trend could occur.
Read Data
ThingSpeak channel 471839 contains delayed financial data for Google (NASDAQ: GOOGL). The data is updated once per day. The first four fields contain the open, high, low, and close price, respectively. Field five contains the daily trading volume. Read the data from channel 471939 using the thingSpeakRead function.
stockTimeTable=thingSpeakRead(471839,'numDays',150,'outputFormat','TimeTable');
Generate the MCAD Data and Label Crossings
When the MACD and the signal line have just crossed, and the MACD line falls below the moving average line, it is time to sell. Use the macd function to construct the MACD line and the moving average or signal line data. Then scan the data points to look for the points where the lines cross, and save those points to an array for plotting.
[MACDLine, signalLine]= macd(stockTimeTable);

index=26;
crossUp=[];
crossDown=[];

while (index<height(stockTimeTable))
    if and(MACDLine.Close(index)>signalLine.Close(index),MACDLine.Close(index-1) < signalLine.Close(index-1))
       crossUp=[crossUp index];
    end

    if and(MACDLine.Close(index)<signalLine.Close(index),MACDLine.Close(index-1) > signalLine.Close(index-1))
       crossDown=[crossDown index];
    end
    index=index+1;
end
Plot the MACD and Signal Indicators
Use the plot function to plot the MACD for Google. Add line-crossing labels using the text function.
plot(MACDLine.Time,MACDLine.Close,'r+-',signalLine.Time,signalLine.Close, 'b--');
legend('MACD Line','Nine Per MA')
title('MACD for GOOG')
ylabel("Price Averages");
hold;
text(MACDLine.Time(crossUp),MACDLine.Close(crossUp),'B');
text(MACDLine.Time(crossDown),MACDLine.Close(crossDown),'S');
Current plot held
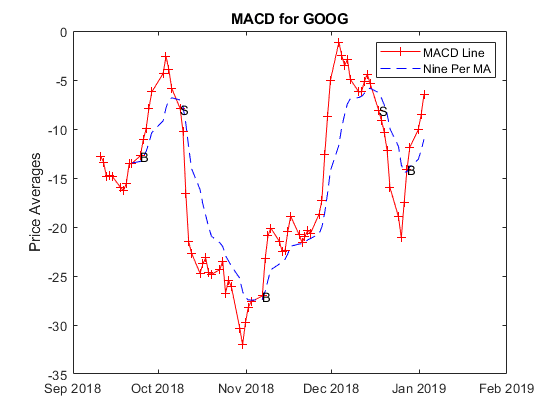
The plot shows the MACD for Google. The MACD line crossed the signal line at several locations indicating that there were some potentially profitable trade opportunities. Since the plot is generated from live data, your plot is different from the example shown here.
See Also
Functions
thingSpeakRead|macd(Financial Toolbox) |text(MATLAB)