Visualize Document Clusters Using LDA Model
This example shows how to visualize the clustering of documents using a Latent Dirichlet Allocation (LDA) topic model and a t-SNE plot.
A latent Dirichlet allocation (LDA) model is a topic model which discovers underlying topics in a collection of documents and infers word probabilities in topics. The vectors of per-topic word probabilities characterize the topics. You can evaluate document similarity using an LDA model by comparing the per-document topic probabilities, also known as topic mixtures.
Load LDA Model
Load the LDA model factoryReportsLDAModel which is trained using a data set of factory reports detailing different failure events. For an example showing how to fit an LDA model to a collection of text data, see Analyze Text Data Using Topic Models.
load factoryReportsLDAModel
mdl
mdl =
ldaModel with properties:
NumTopics: 7
WordConcentration: 1
TopicConcentration: 0.5755
CorpusTopicProbabilities: [0.1587 0.1573 0.1551 0.1534 0.1340 0.1322 0.1093]
DocumentTopicProbabilities: [480×7 double]
TopicWordProbabilities: [158×7 double]
Vocabulary: [1×158 string]
TopicOrder: 'initial-fit-probability'
FitInfo: [1×1 struct]
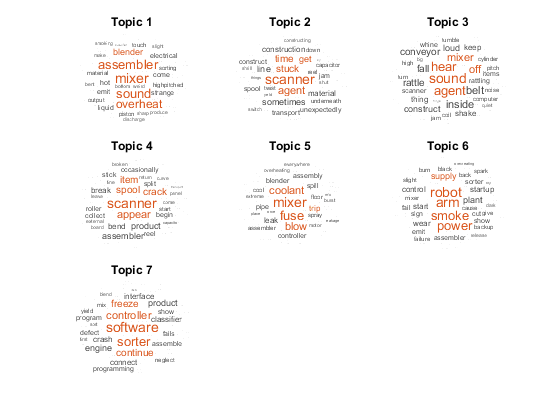
Visualize the topics using word clouds.
numTopics = mdl.NumTopics;

figure
tiledlayout("flow")
title("LDA Topics")

for i = 1:numTopics
    nexttile
    wordcloud(mdl,i);
    title("Topic " + i)
end
Visualize Document Clusters Using t-SNE
The t-distributed stochastic neighbor embedding (t-SNE) algorithm projects high-dimensional vectors to 2-D space. This embedding makes it easy to visualize similarity between high-dimensional vectors. By plotting the document topic mixtures according to the t-SNE algorithm, you can visualize the clustering of similar documents.
Project the topic mixtures in the DocumentTopicProbabilties property into 2-D space using the tsne function.
XY = tsne(mdl.DocumentTopicProbabilities);
For the plot groups, identify the top topic for each document.
[~,topTopics] = max(mdl.DocumentTopicProbabilities,[],2);
For the plot labels, find the top three words for each topic.
for i = 1:numTopics
    top = topkwords(mdl,3,i);
    topWords(i) = join(top.Word,", ");
end
Plot the projected topic mixtures using the gscatter function. Specify the top topics as the grouping variable and display a legend with the top words for each topic.
figure
gscatter(XY(:,1),XY(:,2),topTopics)

title("Topic Mixtures")

legend(topWords, ...
    Location="southoutside", ...
    NumColumns=2)
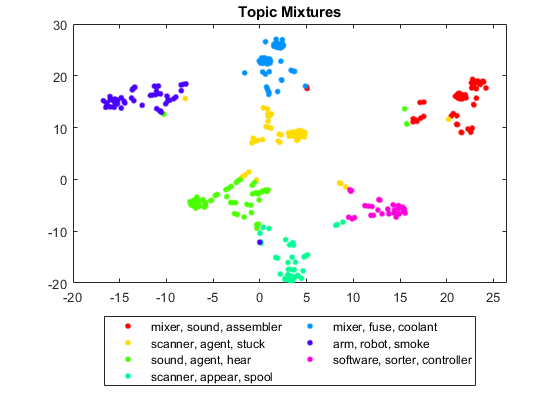
The t-SNE plot highlights clusters occurring in the original high-dimensional data.
See Also
tokenizedDocument | fitlda | ldaModel | wordcloud | documentEmbedding