Find Asymptotes, Critical, and Inflection Points
This example describes how to analyze a simple function to find its asymptotes, maximum, minimum, and inflection point.
Define a Function
The function in this example is
First, create the function.
syms x
num = 3*x^2 + 6*x -1;
denom = x^2 + x - 3;
f = num/denom
f =
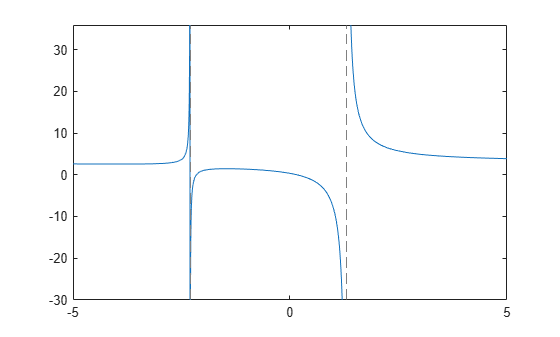
Plot the function by using fplot. The fplot function automatically shows vertical asymptotes.
fplot(f)
Find Asymptotes
To find the horizontal asymptote of mathematically, take the limit of as approaches positive infinity.
limit(f,Inf)
ans =
The limit as approaches negative infinity is also 3. This result means the line is a horizontal asymptote to .
To find the vertical asymptotes of , set the denominator equal to 0 and solve it.
roots = solve(denom)
roots =
roots indicates that the vertical asymptotes are the lines
and
.
Find Maximum and Minimum
You can see from the graph that has a local maximum between the points and . It also has a local minimum between and . To find the -coordinates of the maximum and minimum, first take the derivative of .
f1 = diff(f)
f1 =
To simplify this expression, enter the following.
f1 = simplify(f1)
f1 =
Next, set the derivative equal to 0 and solve for the critical points.
crit_pts = solve(f1)
crit_pts =
As the graph of shows, the function has a local minimum at
and a local maximum at
.
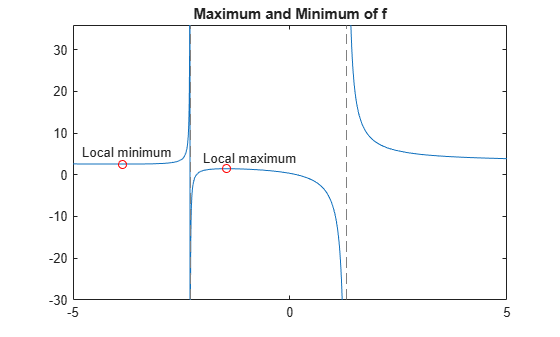
Plot the maximum and minimum of f.
fplot(f)
hold on
plot(double(crit_pts), double(subs(f,crit_pts)),'ro')
title('Maximum and Minimum of f')
text(-4.8,5.5,'Local minimum')
text(-2,4,'Local maximum')
hold off
Find Inflection Point
To find the inflection point of , set the second derivative equal to 0 and solve for this condition.
f2 = diff(f1);
inflec_pt = solve(f2,'MaxDegree',3);
double(inflec_pt)
ans = 3×1 complex
-5.2635 + 0.0000i
-1.3682 - 0.8511i
-1.3682 + 0.8511i
In this example, only the first element is a real number, so this is the only inflection point. MATLAB® does not always return the roots to an equation in the same order.
Instead of selecting the real root by indexing into inter_pt, identify the real root by determining which roots have a zero-valued imaginary part.
idx = imag(double(inflec_pt)) == 0;
inflec_pt = inflec_pt(idx)
inflec_pt =
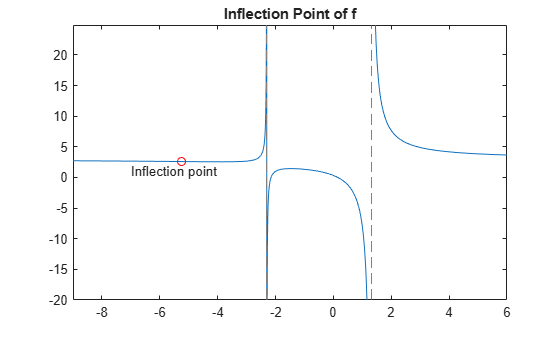
Plot the inflection point. The extra argument [-9 6] in fplot extends the range of values in the plot so that you can see the inflection point more clearly, as the figure shows.
fplot(f,[-9 6])
hold on
plot(double(inflec_pt), double(subs(f,inflec_pt)),'ro')
title('Inflection Point of f')
text(-7,1,'Inflection point')
hold off