Noncentral t Distribution
Definition
The most general representation of the noncentral t distribution is quite complicated. Johnson and Kotz (1994) give a formula for the probability that a noncentral t variate falls in the range [–u, u].
I(x|ν,δ) is the incomplete beta function with parameters ν and δ. δ is the noncentrality parameter, and ν is the number of degrees of freedom.
Background
The noncentral t distribution is a generalization of Student's t distribution.
Student's t distribution with n – 1 degrees of freedom models the t-statistic
where is the sample mean and s is the sample standard deviation of a random sample of size n from a normal population with mean μ. If the population mean is actually μ0, then the t-statistic has a noncentral t distribution with noncentrality parameter
The noncentrality parameter is the normalized difference between μ0 and μ.
The noncentral t distribution gives the probability that a t test will correctly reject a false null hypothesis of mean μ when the population mean is actually μ0; that is, it gives the power of the t test. The power increases as the difference μ0 – μ increases, and also as the sample size n increases.
Examples
Compute and Plot Noncentral t Probability Density Function
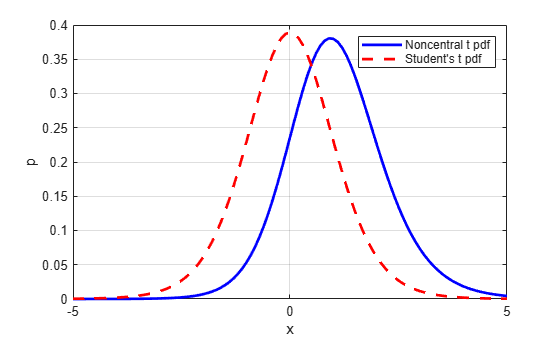
Compute the probability density function (pdf) of a noncentral t distribution with the degrees of freedom nu=10 and noncentrality parameter delta=1. For comparison, also compute the pdf of a Student's t distribution with the same degrees of freedom.
x = -5:0.1:5;
nu = 10;
delta = 1;
nct = nctpdf(x,nu,delta);
t = tpdf(x,nu);
Plot the noncentral t pdf and the Student's t pdf on the same figure.
figure
plot(x,nct,"b-",LineWidth=2)
hold on
grid on
plot(x,t,"r--",Linewidth=2)
xlabel("x")
ylabel("p")
legend("Noncentral t pdf","Student's t pdf")
hold off
See Also
nctcdf | nctpdf | nctinv | nctstat | nctrnd | random