Distribution Fitter
Fit probability distributions to data
Description
The Distribution Fitter app interactively fits probability distributions to data imported from the MATLAB® workspace. You can choose from 22 built-in probability distributions or create your own custom distribution. The app displays plots of the fitted distribution superimposed on a histogram of the data. Available plots include probability density function (pdf), cumulative distribution function (cdf), probability plots, and survivor functions. You can export the fitted parameter values to the workspace as a probability distribution object, and use object functions to perform further analyses. For more information on working with these objects, see Working with Probability Distributions. For the programmatic work flow of the Distribution Fitter app, see Programmatic Use.
Required Products
MATLAB
Statistics and Machine Learning Toolbox™
Open the Distribution Fitter App
MATLAB Toolstrip: On the Apps tab, under Math, Statistics and Optimization, click the app icon.
MATLAB command prompt: Enter
distributionFitter.
Examples
Load the carsmall sample data.
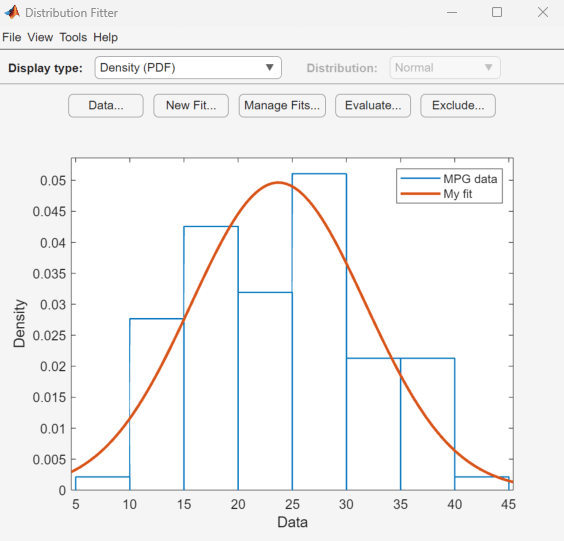
load carsmallOpen the Distribution Fitter app using the MPG miles per gallon data.
distributionFitter(MPG)
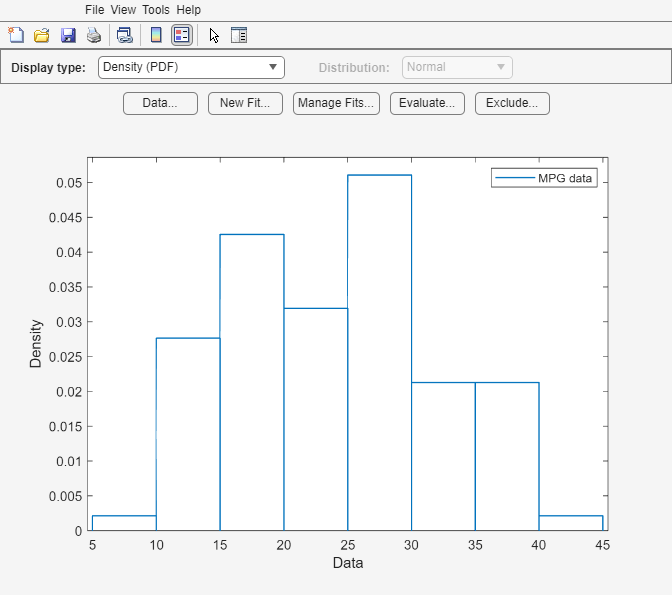
The Distribution Fitter app opens, populated with the MPG data, and displays the density (PDF) plot. You can use the app to display different plots and fit distributions to this data.
Load the sample data.
load lightbulb.matThe first column of the data contains the lifetime (in hours) of two types of light bulbs. The second column contains information about the type of light bulb. 1 indicates fluorescent bulbs, and 0 indicates the incandescent bulb. The third column contains censoring information. 1 indicates censored data, and 0 indicates the exact failure time. This is simulated data.
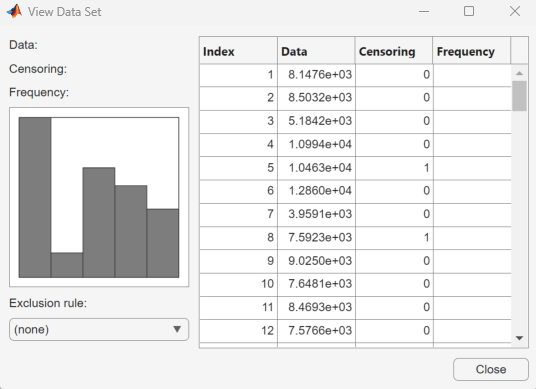
Open the Distribution Fitter app using the first column of lightbulb as the input data, and the third column as the censoring data. Name the data lifetime.
distributionFitter(lightbulb(:,1),lightbulb(:,3),[],"lifetime")
To open the Data dialog box, click Data. In the Manage data sets pane, click to highlight the lifetime data set row. Finally, to open the View Data Set dialog box, click View. The lifetime data appears in the second column and the corresponding censoring indicator appears in the third column.