Create and Edit Simulink Based States
To model systems that switch between periodic or continuous time dynamics, use Simulink® based states. For more information, see Simulink Subsystems as States.
You can create Simulink based state by using the object palette. To reuse systems from separate Simulink models, copy and paste enabled subsystems. To reuse subsystems in multiple Stateflow® charts, copy and paste action subsystems that are saved in a library.
Create a Simulink Based State
To create a Simulink based state, do one of the following:
Create an empty Simulink based state by using the Simulink based state palette icon.
Create a Simulink based state from another model by copying an enabled subsystem or an action subsystem to your Stateflow chart.
Create a linked Simulink based state by copying an action subsystem from a library to your Stateflow chart.
Create an Empty Simulink Based State
In the object palette, click the Simulink state icon
 .
.On the chart canvas, click the location for the new Simulink based state.
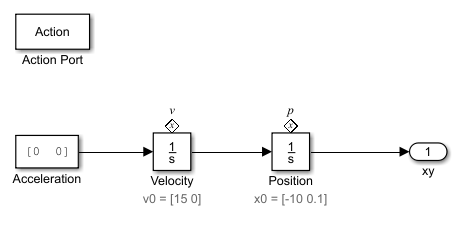
Enter a name for the state. In this example, the state models a pole vaulter running along a flat surface, so the state label is
Run_up. Simulink based states are action subsystems, so an Action Port appears with your new state.
Build your Simulink subsystem. This subsystem outputs the Cartesian coordinates of the pole vaulter. For more information about this model, see Access Block State Data.
Create Simulink Based State from Enabled Subsystem
To create a Simulink based state in your Stateflow chart, copy enabled subsystems from separate Simulink models. You can reuse components from Simulink models in a Stateflow chart without creating a brand new Simulink based state.
1. Open the model sf_clutch_enabled_subsystems.

2. From the model, copy the block Slipping to your Stateflow chart.

3. The inports and outports of your Simulink subsystem appear as undefined symbols in your Stateflow chart. To add corresponding input and output data to your Stateflow chart, open the Symbols pane and click the Resolve undefined symbols button.
Create a Linked Simulink Based State
To create a linked Simulink based state in your Stateflow chart, copy an action subsystem from a library to Stateflow. When the library block is updated, the changes are reflected in all Stateflow charts containing the block.
Open the library model
sf_pole_vault_lib.openExample("sf_pole_vault_lib")Copy and paste the library block
Run_upto your Stateflow chart.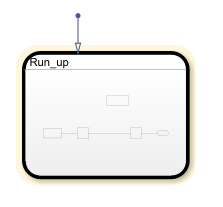
To display a link in the bottom leftmost corner on a linked subsystem, in the Debug tab, select Information Overlays > Show All Links.

The outports of this Simulink subsystem,
xy, appears as an undefined symbol in your Stateflow chart. To add a corresponding output data to your Stateflow chart, click the Resolve undefined symbols button .
.
Create Inports and Outports
When using Simulink based states, inports and outports for your Simulink subsystem connect to input and output data at the Stateflow chart level. This connection allows the top-level Simulink model to read data from the subsystem contained within your Simulink based state.
When you create an empty Simulink based state, Stateflow creates inputs and outputs in your Simulink subsystem that correspond to inputs and outputs that exist in the parent Stateflow chart. However, if you add inports and outports to your Simulink based state after it is created, you must create corresponding input and output data for your Stateflow chart.
To create additional inports or outports for a Simulink based state:
Open your Simulink based state.
Click the Simulink canvas, type
in1, and press Enter. An undefined inport is created.The undefined symbol
in1appears in the Symbols pane of your Stateflow chart. To resolve the undefined symbol, click the Resolve undefined symbols button.A chart inport named
In1is created.
Create an Additional Outport
In this example, you create an additional outport for the model
sf_pole_vault:
Open the model
sf_pole_vault.openExample("sf_pole_vault")Open the chart
PoleVaulterand double-click Simulink based stateTake_off.Click the Simulink based state canvas and type
out1and press Enter. An undefined outport is created. Rename the outporttheta_outand connect it to the signal for theta.
In the Symbols pane of
PoleVaulter, an undefined symbol fortheta_outappears. To resolve the undefined symbol, click the Resolve undefined symbols button. 
Stateflow creates an output in the chart called
theta_outthat corresponds to the outporttheta_out.