Debugging Test Failures Using Model Slicer
This example shows how to debug Simulink Test baseline and verification failures by using the Model Slicer.
A predefined baseline test case is provided for use with the sltestDemo_fuelsys model. The baseline is captured from an earlier state of the model. After capturing the baseline, a design error is introduced in the model, which causes the baseline test to fail. Then, the Model Slicer is used to debug the failure and localize the design error.
For information about the Model Slicer, see the Simulink Check documentation.
Step 1: Setting Up the Artifacts
This section describes how to run the test case and view the results.
1. Open the sltestDemo_fuelsys model.
open_system('sltestDemo_fuelsys');

2. Click APPS > Model Verification, Validation, and Test > Simulink Test to open the Simulink Test toolstrip.
3. Click Tests > Simulink Test Manager to open the Test Manager.
4. To open the existing test file, from the Test Manager toolstrip, click Open and select slTestBaselineFailureEx.
5. After the test file loads, select New Test Case1 in the Test Browser pane.
6. Click Run.

7. The new test results appear at the top of the Results and Artifacts pane. Right-click the result and select Expand All Under, so that you see the Baseline Criteria Result and the Verify Statements.

Observe that four signals have failed: air_fuel_ratio, ego, fuel, and FuelModeAssertion. This example uses the failed fuel signal to illustrate the debugging workflow.
Step 2: Entering Debug Session
This section describes how to setup the Model Slicer for debugging the failed fuel signal.
1. To compare the fuel signals between the model and the baseline, expand the Baseline Criteria Result and select the radio button next to the fuel signal. Likewise, to debug a verify signal, expand the Verify Statements and select the failed verify signal. Another way to select a failed signal is from the Signal to Debug dropdown list in the toolbar.
In the plot area, compare the model output to the baseline data.

2. Click Debug in the TOOLS section of the toolstrip. Note that the Debug option is enabled only when a failed baseline or verify signal is plotted.
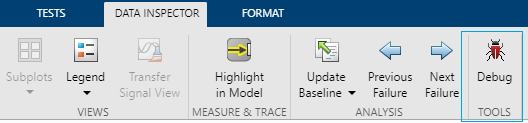
The DEBUG tab replaces all existing toolstrip tabs. Multiple Test Manager options are hidden or disabled to create the debug environment.
3. To set up the Model Slicer, click Debug Using Slicer.

Debug Using Slicer prepares the debugging session by:
Rerunning the test case and creating new debugging results. This makes sure that the failure still exists in the current state of the test model.
Launching the Model Slicer on the test model.
Automatically plotting the selected failed signal in the debugging results, and setting the failed signal as the starting time point.
Pausing the simulation at the model start time to continue debugging.
Step 3: Debugging using Model Slicer
This section explains how to focus in on the reason for the failure by using the debugging features of the Model Slicer.
1. Use the Step Back/Step Forward buttons to move one step back or forward in simulation time. The left data cursor moves to the current simulation time. Observe the changes in the data dependencies by noting the changed model highlighting and port value labels for the active signals at every time stamp.

You can also use Run/Continue/Stop to run a new simulation, or complete or stop the current simulation.
2. In the Test Manager, click Continue to Failure to continue the model simulation to the beginning of the next failure region. The data cursors show the bounds of the failure region.

Observe these changes at the failure:
Simulation pauses at T = 4.81.
Data cursors update accordingly.
Difference between the Baseline and Sim Output is 0.007.

From the Model Slicer highlighting, you can find the cause of this difference, and see that the sltestDemo_fuelsys/To Plant/fuel value depends on sltestDemo_fuelsys/To Plant.

3. Open sltestDemo_fuelsys/To Plant. Notice that there is no change in the value being propagated.

4. Open sltestDemo_fuelsys/fuel_rate_control.

Observe that the fb_correction value is 0. The difference between the Baseline and the Sim Output is 0.007, which is a small value. It might be that fb_correction is not calculated correctly.
5. Open sltestDemo_fuelsys/fuel_rate_control/airflow_calc, which computes the fb_correction, and observe the data dependencies.
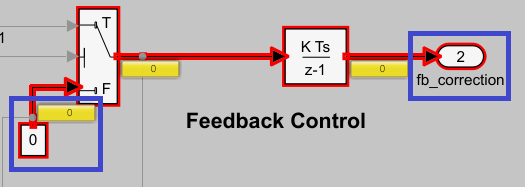
Notice that the constant, 0, is being passed through the sltestDemo_fuelsys/fuel_rate_control/airflow_calc/hold integrator switch block. To determine why the control port evaluates to false for the switch block, the control dependencies need to be highlighted on the model.
6. Enable Display Control Dependencies from the Simulation Time Window section in the Model Slicer Dialog docked on the model.
Observe that:
sltestDemo_fuelsys/fuel_rate_control/airflow_calc/fuel_modevalue is LOW, butfb_correctionis still zero.fuel_modeis compared tosltestDemo_fuelsys/fuel_rate_control/airflow_calc/Enumerated Constant, which evaluates to false.

The Enumerated Constant value is set to sld_FuelModes.RICH. It should be checking against the fuel_mode value sld_FuelModes.LOW.
Step 4: Incorporating the fix
1. Exit the debugging session by clicking SESSION > Close Debug.
2. Open the model and update the sltestDemo_fuelsys/fuel_rate_control/airflow_calc/Enumerated Constant value to sld_FuelModes.LOW.
3. Save the model.
4. Run the test case and view the results.
Now, observe that the test results show the test as having passed.
Capabilities and Limitations
If you use the Test Manager to set a simulation mode to one other than normal mode, such as SIL or PIL, you cannot use the Model Slicer for debugging.
If the simulation mode is set in the model configuration, the Model Slicer changes the mode of the model and all referenced models to run in normal mode and then, you can use the Model Slicer for debugging.
For models that do not support Fast Restart mode, the SIMULATION section of the toolstrip is disabled. Use the ANALYSIS section to debug the failure.
The ANALYSIS section is available only when the model is not simulating, such as when you click Continue or Stop in the SIMULATION section. It highlights a time region instead of a time step. To define a time region, move the data cursors manually, or use Next Failure or Previous Failure. Then, you can use Update Slicer Highlight to update the model highlighting for the defined time slice.
The Results must be generated from the current release.
Related Topics
Select a Web Site
Choose a web site to get translated content where available and see local events and offers. Based on your location, we recommend that you select: United States.
You can also select a web site from the following list
Americas
- América Latina (Español)
- Canada (English)
- United States (English)
Europe
- Belgium (English)
- Denmark (English)
- Deutschland (Deutsch)
- España (Español)
- Finland (English)
- France (Français)
- Ireland (English)
- Italia (Italiano)
- Luxembourg (English)
- Netherlands (English)
- Norway (English)
- Österreich (Deutsch)
- Portugal (English)
- Sweden (English)
- Switzerland
- United Kingdom (English)
Asia Pacific
- Australia (English)
- India (English)
- New Zealand (English)
- 中国
- 日本Japanese (日本語)
- 한국Korean (한국어)