Analyze a Stateflow Atomic Subchart
In a Stateflow® chart, an atomic subchart is a graphical object that allows you to reuse the same state or subchart across multiple charts and models. You can use Simulink® Design Verifier™ to analyze atomic subcharts individually. You do not have to analyze the chart that contains the atomic subchart, or the model that contains the chart.
If you are having problems analyzing a large model, analyzing an atomic subchart in a controlled environment is helpful. As described in Bottom-Up Approach to Model Analysis, by analyzing atomic subcharts or other components in the model hierarchy individually, you can analyze a model to:
Solve problems that slow down or prevent test generation, property proving, or design error detection.
Analyze model components that are unreachable in the context of the container model or chart.
Note
For more information about atomic subcharts, see Create Reusable Subcomponents by Using Atomic Subcharts (Stateflow).
Analyze an Atomic Subchart by Using Simulink Design Verifier
The sf_atomic_sensor_pair example model models a redundant
sensor pair using atomic subcharts. This example analyzes the
Sensor1 subchart in the RedundantSensors
chart.
Open the
sf_atomic_sensor_pairexample model:openExample('stateflow/ModelingARedundantSensorPairUsingAtomicSubchartExample',... 'supportingFile','sf_atomic_sensor_pair');
This model demonstrates how to model a simple redundant sensor pair using atomic subcharts.
Double-click the
RedundantSensorschart to open it.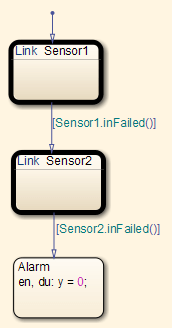
This Stateflow chart has two atomic subcharts:
Sensor1Sensor2
To analyze the
Sensor1subchart using Simulink Design Verifier, right-click the subchart and select Design Verifier > Generate Tests for Subchart.During the analysis, the software creates a Simulink model named
Sensor1that contains theSensor1subchart. The new model contains Inport and Outport blocks that respectively correspond to the data objectsuandyin the subchart.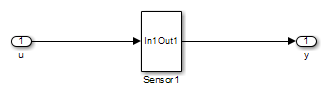
The software saves the new model and other files generated by the analysis in:
<current_folder>/sldv_output/Sensor1
When the analysis is complete, view the analysis results for the
Sensor1subchart by clicking one of the following options:Highlight analysis results on model
Generate detailed analysis report
Create harness model
Simulate tests and produce a model coverage report