Collect Code Coverage Metrics with Simulink Coverage
This example shows how to collect code coverage metrics during a software-in-the-loop (SIL) or processor-in-the-loop (PIL) simulation with Simulink® Coverage™.
You use the code coverage tool and code coverage report to view the recorded code coverage for a SIL simulation.

In this example, you measure model coverage during a simulation in normal mode, repeat the same simulation in SIL mode, and compare the recorded metrics from both simulations.
Compare model coverage and code coverage results by using the hyperlinks in the model coverage and code coverage reports.
For more examples of measuring SIL and PIL simulations, see Test Generated Code with SIL and PIL Simulations (Embedded Coder).
Initial Setup
Open the model.
model = "SILTopModel";
close_system(model,0);
open_system(model);
Remove any existing build folders.
buildFolder = RTW.getBuildDir(model);
if isfolder(buildFolder.BuildDirectory)
    rmdir(buildFolder.BuildDirectory,'s');
end
Configure the model for coverage analysis.
set_param(model,"CovEnable","on")
clear covCumulativeData
Set up the input data.
T = 0.1; % sample time
[ticks_to_count,reset,counter_mode,count_enable, ...
    counter_mode_values_run1,counter_mode_values_run2, ...
    count_enable_values_run1,count_enable_values_run2] = ...
    SILTopModelData(T);
Run the First Simulation in Normal Mode
After the simulation completes, the model coverage report opens. To navigate from blocks in the model to the corresponding sections of the coverage report, use the coverage display window.
counter_mode.signals.values = counter_mode_values_run1;
count_enable.signals.values = count_enable_values_run1;
set_param(model,"SimulationMode","normal");
Use the Simulation Data Inspector to view and compare simulation results.
Simulink.sdi.view;
Simulink.sdi.clear;
Run the simulation.
simout_normal_run1 = sim(model,"ReturnWorkspaceOutputs","on");
Highlight the model.
cvmodelview(simout_normal_run1.covdata);
Capture the results.
Simulink.sdi.createRun("Run 1 (normal mode)","namevalue",...
                       {'simout_normal_run1'},{simout_normal_run1});
Run the Second Simulation in Normal Mode
For the first simulation, the report shows that the model achieved less than 100% MCDC coverage. Run a second simulation with different input signals to increase the level of MCDC coverage to 100%. The model coverage report is configured to show cumulative coverage across both simulation runs.
counter_mode.signals.values = counter_mode_values_run2;
count_enable.signals.values = count_enable_values_run2;
set_param(model,"SimulationMode","normal");

simout_normal_run2 = sim(model,"ReturnWorkspaceOutputs","on");

cvmodelview(simout_normal_run2.covdata);

Simulink.sdi.createRun("Run 2 (normal mode)","namevalue",...
                       {'simout_normal_run2'},{simout_normal_run2});
Configure the Model to Measure Code Coverage
Before running a SIL simulation, configure the model to collect code coverage metrics.
coverageSettings = get_param(model,"CodeCoverageSettings");
coverageSettings.CoverageTool = "Simulink Coverage";
coverageSettings.TopModelCoverage = "on";
set_param(model,"CodeCoverageSettings",coverageSettings);
Run the First Simulation in SIL Mode
You can use the same input signals in the SIL simulation that you used during the first simulation run in normal mode.
Run the first simulation in SIL mode.
counter_mode.signals.values = counter_mode_values_run1;
count_enable.signals.values = count_enable_values_run1;
set_param(model,"SimulationMode","software-in-the-loop");
set_param(model,"CodeExecutionProfiling","off");
set_param(model,"CodeProfilingInstrumentation","off");
simout_sil_run1 = sim(model,"ReturnWorkspaceOutputs","on");
### Searching for referenced models in model 'SILTopModel'.
### Total of 1 models to build.
### Starting build procedure for: SILTopModel
### Successful completion of build procedure for: SILTopModel

Build Summary

Top model targets:

Model        Build Reason                                         Status                        Build Duration
==============================================================================================================
SILTopModel  Information cache folder or artifacts were missing.  Code generated and compiled.  0h 0m 11.027s

1 of 1 models built (0 models already up to date)
Build duration: 0h 0m 11.698s
### Preparing to start SIL simulation ...
Building with 'gcc'.
MEX completed successfully.
### Updating code generation report with SIL files ...
### Starting SIL simulation for component: SILTopModel
### Application stopped
### Stopping SIL simulation for component: SILTopModel
### Completed code coverage analysis
cvmodelview(simout_sil_run1.covdata);
Simulink.sdi.createRun("Run 1 (SIL mode)","namevalue",...
                       {'simout_sil_run1'},{simout_sil_run1});
When the simulation completes, view the code coverage results on the model by using coverage highlighting. To see the SIL code coverage summary for a model element, place your cursor over the model element.
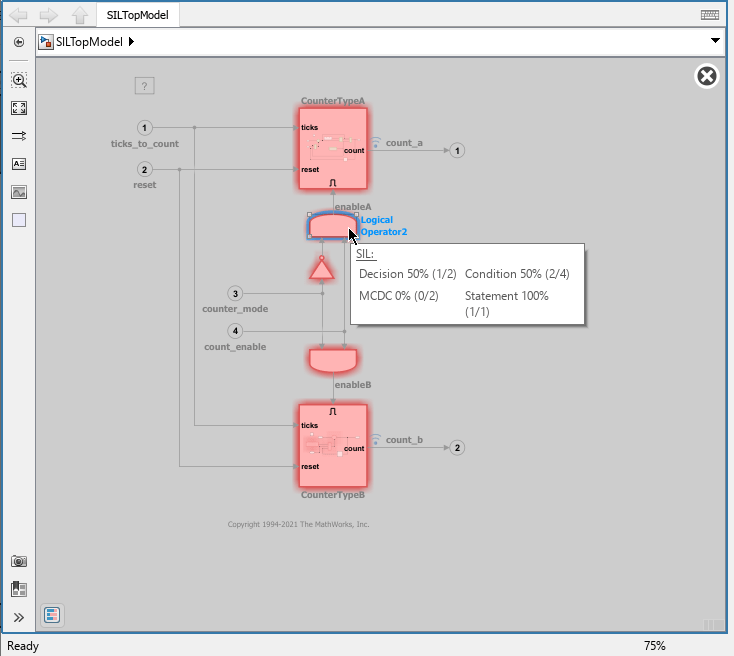
You can also view the code coverage results in the HTML code coverage report. The summary section shows that all functions have been called, but the SIL simulation run did not achieve full coverage for decision, condition, or MCDC coverage.
cvhtml("codecovreport",simout_sil_run1.covdata);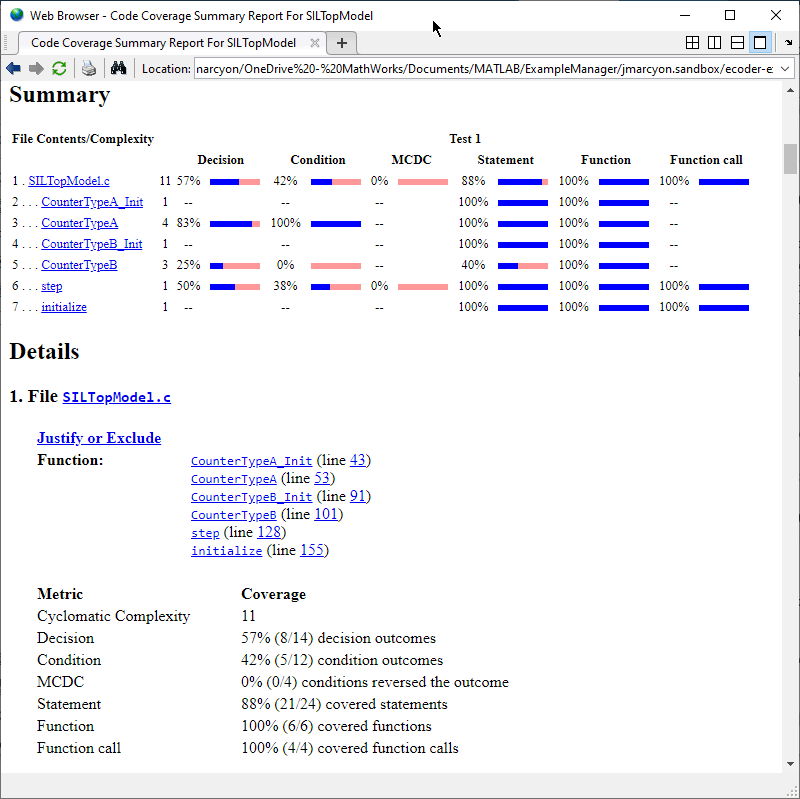
To navigate to the corresponding model elements in the block diagram, use the hyperlinks in the code coverage report.
Run the Second Simulation in SIL mode
Use the same input signals in the SIL simulation that you used in the second simulation run in normal mode.
counter_mode.signals.values = counter_mode_values_run2;
count_enable.signals.values = count_enable_values_run2;
set_param(model,"SimulationMode","software-in-the-loop");
set_param(model,"CodeExecutionProfiling","off");
set_param(model,"CodeProfilingInstrumentation","off");
simout_sil_run2 = sim(model,"ReturnWorkspaceOutputs","on");
### Searching for referenced models in model 'SILTopModel'.
### Total of 1 models to build.
### Starting build procedure for: SILTopModel
### Generated code for 'SILTopModel' is up to date because no structural, parameter or code replacement library changes were found.
### Successful completion of build procedure for: SILTopModel

Build Summary

Top model targets:

Model        Build Reason                             Status          Build Duration
====================================================================================
SILTopModel  Compilation artifacts were out of date.  Code compiled.  0h 0m 2.6618s

1 of 1 models built (0 models already up to date)
Build duration: 0h 0m 3.1609s
### Preparing to start SIL simulation ...
### Starting SIL simulation for component: SILTopModel
### Application stopped
### Stopping SIL simulation for component: SILTopModel
### Completed code coverage analysis
Simulink.sdi.createRun("Run 2 (SIL mode)","namevalue",...
                       {'simout_sil_run2'},{simout_sil_run2});
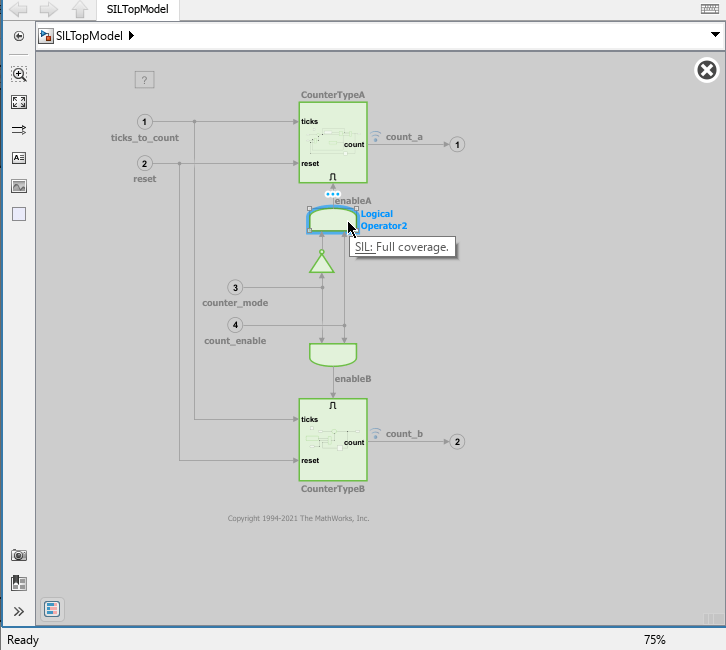
Highlight the model using the cumulative coverage from both SIL mode simulations to see that the generated code from the model achieved full coverage.
cvmodelview(simout_sil_run1.covdata + simout_sil_run2.covdata);
Compare Metrics from the Normal and SIL Simulations
The Simulation Data Inspector opens automatically after each run, which allows you to view and analyze the results. To confirm that the logged signals for the SIL and normal mode runs are identical, review the information in the Compare and Inspect panes.
Furthermore, compare the aggregated condition coverage for the normal mode simulations with the aggregated condition coverage for the SIL mode simulations.
condCovNormal_run1 = conditioninfo(simout_normal_run1.covdata + simout_normal_run2.covdata,model)
condCovNormal_run1 = 1×2

    12    12
condCovSIL_run1 = conditioninfo(simout_sil_run1.covdata + simout_sil_run2.covdata,model)
condCovSIL_run1 = 1×2

    12    12
The normal mode aggregated coverage results shows 12 out of 12 satisfied conditions, resulting in 100% condition coverage, which is consistent with the coverage report for the aggregated normal mode simulations. The SIL mode simulation shows 12 out of 12 satisfied decisions, resulting in 100% condition coverage, which is consistent with the coverage report for that simulation.
You can similarly compare other coverage metrics, however, the number of coverage objectives is does not always match between model and code coverage. There are many semantic differences between a Simulink model and its generated code that could cause differences in the total number of coverage objectives between model and code coverage. As a best practice, you should test your model and achieve your goals for model coverage, such as 100% decision coverage, before moving on to testing in SIL or PIL simulation mode.