Monitor Low-Level Test Results in the Model Testing Dashboard
This example shows how you can use low-level tests to address gaps in your achieved coverage and how to monitor the percentage of the overall achieved coverage that comes from the unit-boundary tests.
A low-level test is a model test that only tests a sub-element of a unit. Sub-elements include atomic subsystems, atomic subsystem references, atomic Stateflow® charts, atomic MATLAB Function blocks, and referenced models. For example, if your test only tests an atomic subsystem inside a unit, the test is a low-level test.
A unit-boundary test is a model test that tests the whole unit.
You can use both unit-boundary tests and low-level tests to achieve coverage. When you run a unit-boundary test, the test has access to the entire context of the unit design. When you run low-level tests, you only test part of the unit. If a high percentage of your overall achieved coverage comes from low-level tests, you may want to expand the scope of your testing by using unit-boundary tests instead.
This example uses Simulink® Check™, Simulink Test™, and Simulink Coverage™.
Open Project Dashboard
1. Open a project that contains models and testing artifacts. For this example, in the MATLAB® Command Window, enter:
openProject("cc_CruiseControl");
2. Open the Dashboard window. On the Project tab, click Model Testing Dashboard.
3. Open the Model Testing Dashboard by clicking Model Testing in the dashboard gallery in the toolstrip.
The dashboard opens a Model Testing tab for the unit cc_ControlMode.
Run Unit-Boundary Test and Identify Model Coverage Gaps
Run a test on the whole unit and use the Model Testing Dashboard to collect the metric results for model coverage.
1. Open the test file associated with the unit cc_ControlMode. In the Model Testing Dashboard, in the Artifacts panel, expand the Tests > Unit Tests folder and double-click the file cc_ControlMode_Tests.mldatx.
The file contains three test suites:
Control Mode Unit Tests— Tests for the atomic subsystemControl_Mode_StateMachineTarget Speed Unit Tests— Tests for the atomic subsystemTarget_Speed_CalculatorCombined Tests— A test for the unitcc_ControlMode
2. Run the test suite Combined Tests by right-clicking Combined Tests and clicking Run. The test suite contains the test case Idle, which is a unit-boundary test for the unit cc_ControlMode.
3. To refresh the Model Coverage widgets and view the model coverage results, click Model Testing Dashboard in the Test Manager toolstrip and click the Collect button on the Dashboard warning banner.
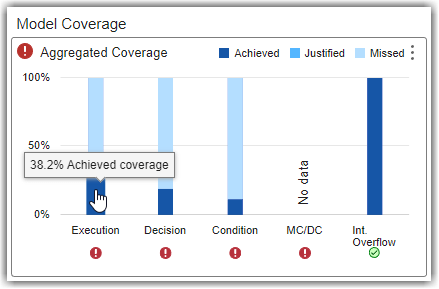
4. View the achieved execution coverage for the unit by pointing to the Execution bar in the Model Coverage subsection.
Based on the results from this unit-boundary test, the achieved execution coverage is 38.2%.
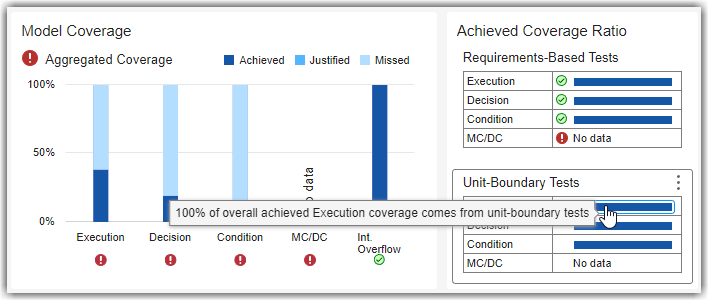
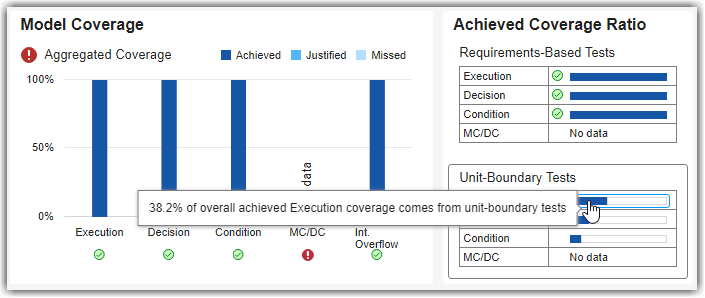
5. To view the overall achieved execution coverage from unit-boundary tests, point to the Execution bar in the Unit-Boundary Tests section under Achieved Coverage Ratio.
Since you only executed a unit-boundary test, Idle, 100% of the overall achieved execution coverage comes from unit-boundary tests.
Use Low-Level Testing to Address Coverage Gaps
Run low-level tests and use the Model Testing Dashboard to observe the increase in model coverage.
1. In the Test Manager, click Test Browser.
2. Run the test suite Target Speed Unit Tests by right-clicking Target Speed Unit Tests and clicking Run.
3. In the Model Testing Dashboard, click the Collect button on the warning banner or toolstrip to refresh the model coverage widgets. In the Model Coverage section, the aggregated model coverage now includes the results from the low-level tests in the test suite Target Speed Unit Tests.
Note that you can only collect aggregated coverage for low-level tests if you have previously run a unit-boundary test. The dashboard cannot calculate aggregated coverage for units that only have test results from low-level tests because lower-level tests do not test the whole unit. The unit-boundary test must be executed on the model, not by software-in-the-loop (SIL) or processor-in-the-loop (PIL) simulations on the model code.
For this example, you could not calculate aggregated coverage without the test results from the test suite Combined Tests. The test suites Control Mode Unit Tests and Target Speed Unit Tests only contain low-level tests and therefore do not test the whole unit.
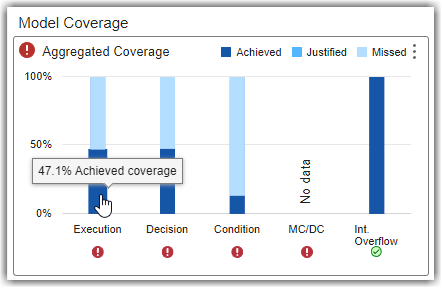
4. View the achieved execution coverage for the unit. In the Model Coverage section, point to the achieved coverage in the Execution bar.
The results from the unit-boundary and low-level tests in the test suite Target Speed Unit Tests increased the achieved execution coverage to 47.1%.
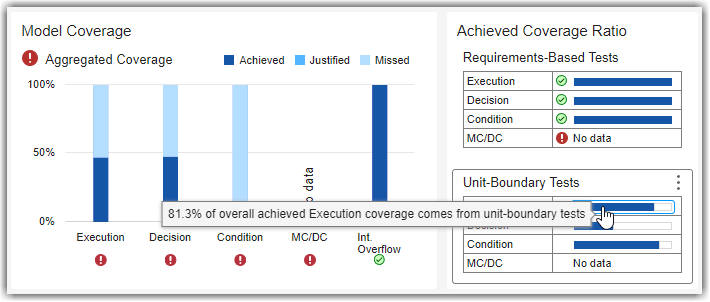
5. View the percentage of the overall achieved execution coverage that comes from unit-boundary tests. In the Achieved Coverage Ratio subsection, under Unit-Boundary Tests, point to the Execution bar.
Since you executed both a unit-boundary test, Idle, and low-level tests, now 81.3% of the overall achieved execution coverage comes from unit-boundary tests.
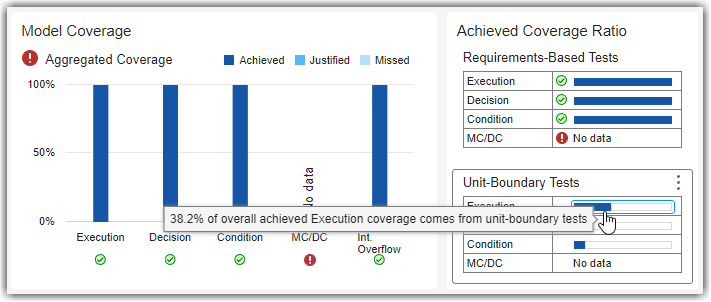
If you run the test suite Control Mode Unit Tests, the unit cc_ControlMode achieves 100% execution, decision, and condition coverage. But, for example, only 38.2% of the achieved execution coverage comes from unit-boundary tests. The remaining 61.8% of overall achieved execution coverage comes from low-level tests.
The low-level tests in the test suites Control Mode Unit Tests and Target Speed Unit Tests enable you to address the model coverage gaps. However, industry-recognized software development standards recommend using unit-boundary tests to confirm coverage completeness. If only a small percentage of your overall achieved coverage comes from unit-boundary tests, consider modifying tests so that they test the functionality of the whole software unit and not just the low-levels like atomic subsystems.