Use Dashboard Panels to Monitor Signals and Control Parameters
A dashboard panel floats above the model canvas and follows you through the model hierarchy. Using panels, you can monitor signals, tune parameters, and debug from anywhere in your model without adding collections of dashboard blocks throughout the model.
You can use panels to model real dashboards, for example, the dashboard in your car. To model displays and controls on the panel, such as gauges, lamps, knobs, buttons, and switches, you can promote blocks to the panel from the Dashboard library, the Customizable Blocks library, and the Aerospace Blockset library. For information about how to create, populate, edit, and manage the visibility of panels, see Getting Started with Dashboard Panels.
In this example, you simulate sensor failures in a fuel control system. You use panels to control the parameter values that activate different failure modes and to monitor the effect on fuel consumption.
Open Example Model
Open the sldemo_fuelsys model from the Model Fault-Tolerant Fuel Control System
example.
openExample('simulink_automotive/ModelingAFaultTolerantFuelControlSystemExample')The sldemo_fuelsys model has a Dashboard subsystem
that contains controls and indicators for interactively simulating the model. Navigate
inside the Dashboard subsystem.
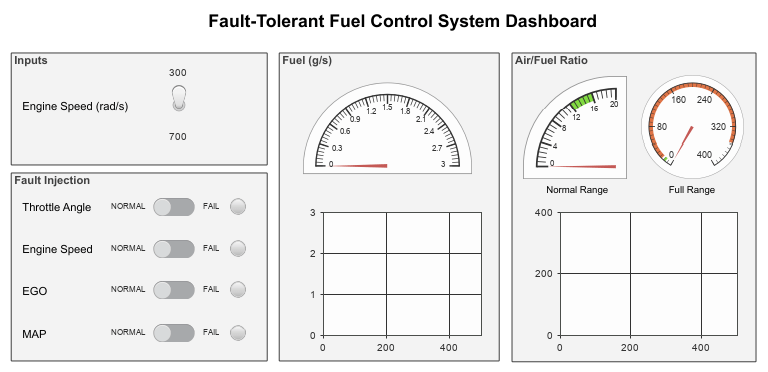
The subsystem contains four areas: Inputs, Fault
Injection, Fuel (g/s), and Air/Fuel
Ratio.
This example creates and then utilizes a panel that contains the control blocks from the
Fault Injection area and a panel that contains the display blocks from
the Fuel (g/s) area.
Create Panels
If you already created a panel containing the dashboard blocks and annotations from the
Fault Injection or Fuel (g/s) areas by working
through the examples in Getting Started with Dashboard Panels or Create Tabbed Dashboard Panels, skip the task for
creating that panel.
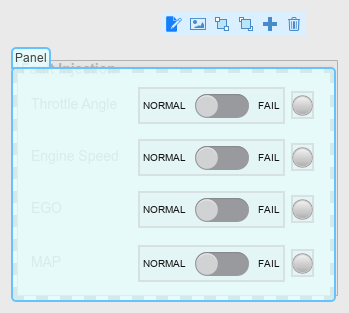
To create the Fault Injection panel, promote the dashboard blocks in
the Fault Injection area to a panel:
Draw a selection box around the blocks. Where the selection box ends, an ellipsis appears.
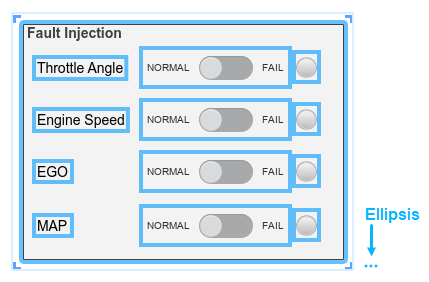
Pause on the ellipsis.
In the action bar that expands, click Promote to Panel
 . The dashboard blocks are promoted from the area to the
panel, but the annotations are not.
. The dashboard blocks are promoted from the area to the
panel, but the annotations are not.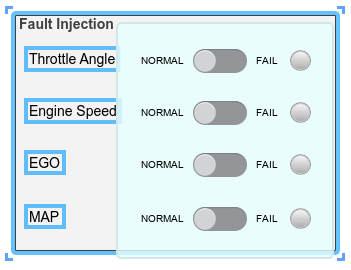
Add the annotations from the Fault Injection area to the
panel:
Select the panel.
Pause on the ellipsis (…) that appears.
In the action bar that expands, click Edit Panel
 .
.Drag the lower left corner of the panel to the left to make room for the annotations.
To see the annotations in the
Fault Injectionarea, drag the panel away from the area. To drag the panel, click and hold down your pointer on the panel name or on any empty spot inside the panel, then move the pointer.For each annotation from the
Fault Injectionarea, double-click the panel where you want the annotation, then type the annotation text. When you finish typing, press Enter. You can drag the annotations to move them around the panel.When you finish, click the canvas.
To rename the panel, in the Simulink® Toolstrip, on the Panels tab, in the Edit section, click Rename Panel. The Property Inspector appears. On the Parameters tab, in the Name text box, type
Fault Injection.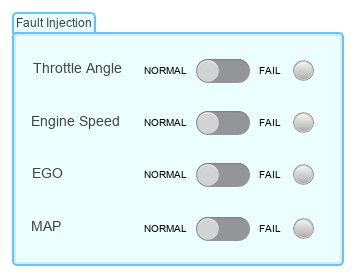
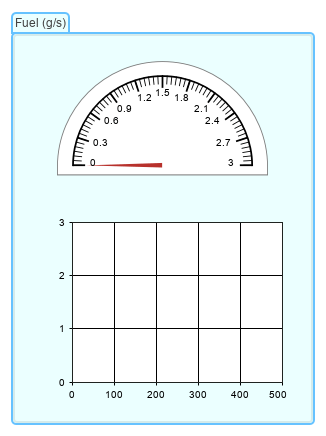
Use the same approach to create the Fuel (g/s) panel from the
dashboard blocks in the Fuel (g/s) area.
Now you have modular panels to use while interactively simulating the
sldemo_fuelsys model.
Simulate Model
Suppose you need to understand and debug the fuel_rate_control
subsystem.
Navigate to the top level of the sldemo_fuelsys model. Navigate
inside the fuel_rate_control subsystem, then navigate inside the
control_logic
Stateflow® chart.
Start a simulation. Once the simulation starts, on the Fault
Injection panel, modify the position of one or more Slider Switch
blocks to induce a failure in the system.
Observe the changes in the Stateflow chart as the system state changes in response to one or more failures.
Observe the changes in fuel consumption by monitoring the panel you created from the
Fuel (g/s)area.
Tip
If the simulation progresses too quickly, you can use simulation pacing to slow the progression of simulation time relative to clock time. For more information, see Simulation Pacing Options.