Simscape Results Explorer
Navigate and plot simulation data logging results
Description
You can use the Simscape™ Results Explorer tool to navigate and plot logged simulation data. Data logging helps you analyze how internal block variables change with time during simulation. For example, you can see if the pressure in a hydraulic cylinder is above a minimum value or compare it against the pump pressure. After you configure your model to log simulation data and run the simulation, use the Simscape Results Explorer tool to navigate and plot the data logging results.
When you click a node in the Model Tree Structure pane of the Simscape Results Explorer, the corresponding plots appear in the right pane. For more information, see Select Nodes to Plot Data.
Use the Simscape Results Explorer toolstrip to import and export the data and control the data display:
| Button | Name | Description |
|---|---|---|
|
| Import Data | Import data from a simulation log variable in the MATLAB® workspace into the Simscape Results Explorer window. When you click this button, you can select from a list of standalone workspace variables and single simulation output objects that contain logged Simscape data. |
|
| Export Data | Export data from the Simscape Results Explorer and save it as a simulation log variable in the MATLAB workspace. |
|
| Linked | Indicates that the Simscape Results Explorer window is linked to the current MATLAB session. Click this button to unlink the window from the session. For more information, see Link to MATLAB Session. |
|
| Unlinked | Indicates that the Simscape Results Explorer window is unlinked from the current MATLAB session. Click this button to link the window to the session. For more information, see Link to MATLAB Session. |
|
| Export Figure | Export the plots currently displayed in the right pane of the Simscape Results Explorer window into a MATLAB figure. |
Use the Axes Control section of the Simscape Results Explorer toolstrip to control the time axis and set the time limits of the plots:
| Name | Description |
|---|---|
| Link Time Axes | If the right pane displays multiple plots, selecting this check box links the time axes of these plots when you pan or zoom. To pan or zoom on a particular plot, clear the Link Time Axes check box. |
| Restore Default Limits | Restore the default plot limits. When you click this button, the Start Time and Stop Time fields display the default time limits for information purposes. |
| Set to Current Plot Limits | Change the plot limits to match the current display. When you click this button, the Start Time and Stop Time fields reflect the time axis limits of the current plot. |
| Start Time | Enter the lower time limit for the plots displayed in the right pane. |
| Stop Time | Enter the upper time limit for the plots displayed in the right pane. |

Open the Simscape Results Explorer
When you configure the model to log simulation data, you can make the Simscape Results Explorer window open and update automatically upon completing a simulation run by selecting the Open viewer after simulation check box in the Configuration Parameters dialog box. For more information on this workflow, see Log, Navigate, and Plot Simulation Data.
Other ways to open the Simscape Results Explorer window are:
Use the
sscexplorefunction.In the model window, on the Simulation tab, click Review Results > Simscape Results Explorer.
Select a Simscape block in the model, and then, on the Simscape Block tab, click Review Results > Results Explorer.
Right-click a block and, from the context menu, select Simscape > View simulation data.
In the MATLAB Workspace browser, double-click the simulation log variable name.
Examples
Select Nodes to Plot Data
When you click a node in the Model Tree Structure pane of the Simscape Results Explorer, the corresponding plots appear in the right pane:
Clicking a node that represents a block displays plots of all the variables in this block.

Clicking a node that represents a variable displays the plot for only this variable.

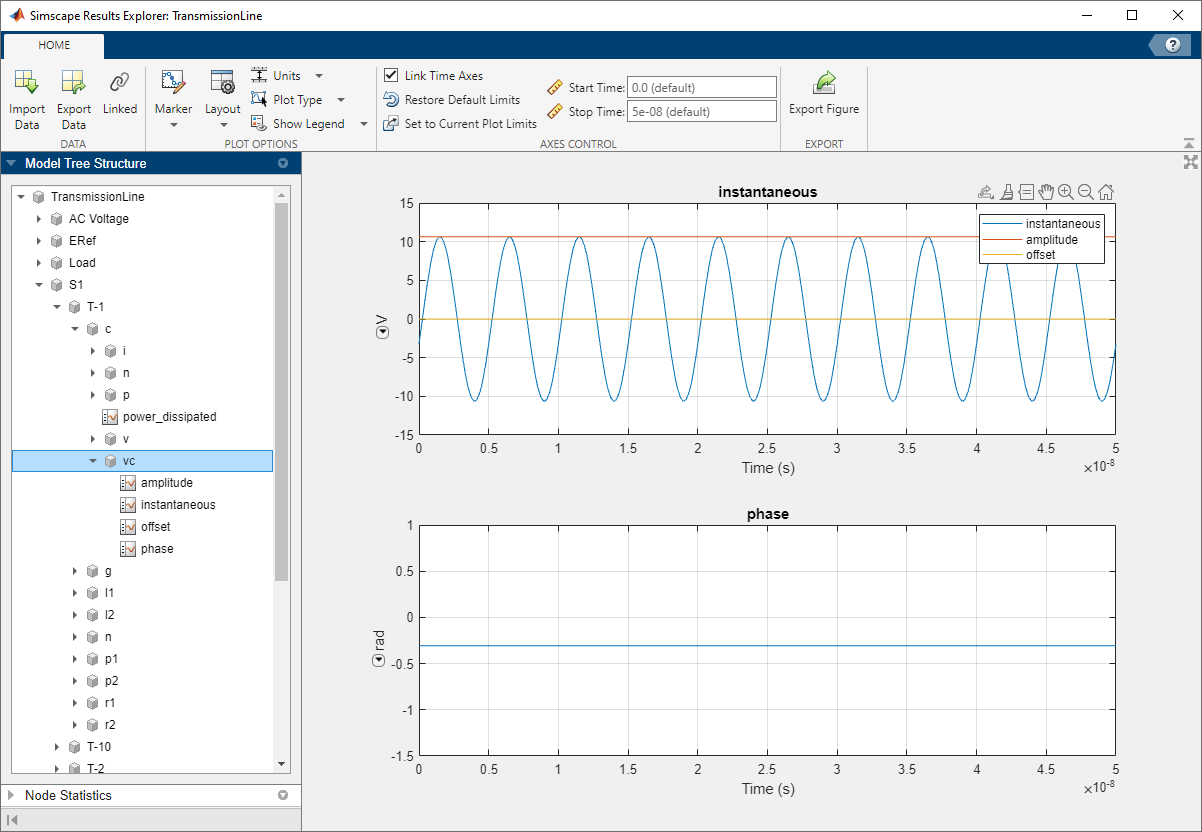
In frequency-and-time simulation mode, clicking a node that represents a frequency variable displays the plots for the instantaneous value, amplitude, offset, and phase of this variable. You can click each of the subnodes to see that data separately. For more information, see Frequency and Time Simulation Mode.
To select several variables for side-by-side plot comparison, press Ctrl and click multiple nodes.

Link to MATLAB Session
When you simulate a model that has the Open viewer after simulation check box in the Configuration Parameters dialog box selected, the data in the Simscape Results Explorer window updates automatically after each simulation run. If this check box is not selected, then the data is not updated automatically. Upon completing a simulation run, you must click Simscape Results Explorer or Results Explorer in the model toolstrip to update the data in the Simscape Results Explorer window.
You can control whether the Simscape Results Explorer window is reused or a new window is opened, after the next simulation run or data update, by linking and unlinking the window.
When you first open the Simscape Results Explorer window, it is linked to the current MATLAB session. This means that when you run a new simulation and update the data, the results in the window will be overwritten. If you have more than one model open, running the simulation or using an update option for any of these models displays the updated results in the same window.
To retain the current results and open a new window after the next simulation or update, click the Linked button in the Simscape Results Explorer window toolbar. The button changes to Unlinked, meaning that this window is now unlinked from simulation. Next time you rerun a simulation or use an option to view the simulation data in the Simscape Results Explorer, a new window opens, and that window is now linked to the session.
Only one window can be linked to the session. Therefore, if you have multiple windows open, clicking the Unlinked button in one of them to link that window to the session unlinks the previous one.
Link to Block Diagram
The Simscape Results Explorer tool provides direct linking to the block diagram. These links let you highlight the appropriate block or open the block dialog box, to easily go from a variable listed in the Simscape Results Explorer tree to the Initial Targets section in the corresponding block dialog box.

When you select a node in the Simscape Results Explorer tree, the Node Statistics panel in the bottom-left corner of the window is collapsed by default. When you expand this panel, it contains these links:
Description — If the node represents a block or subsystem, this link displays the block or subsystem name. If the node represents a variable, this link displays the descriptive variable name, which is the same name that appears in the Initial Targets section of the block dialog box. Clicking the link opens the dialog box for the corresponding block.
For example, in the image above, the selected node
wrepresents a variable calledRotational velocity. Clicking the Description link opens the Inertia block dialog box, which is the parent block for this variable. In the block dialog box, expand the Initial Targets section to see the Rotational velocity variable.
Source — If the node represents a variable, this link displays the name of the parent block for this variable. Clicking the link highlights the corresponding block in the block diagram and opens the appropriate subsystem, if needed.
In the same example, clicking the Source link opens the DC Motor subsystem and highlights the Inertia block, which is the parent block for the selected node
w.
Tip
If the descriptive name of a variable or block is too long to fit into the status
panel, it is truncated with an ellipsis (…). If you point to the
truncated name, the tooltip in the status panel displays the full name.
Log Data for Component Arrays
If your model contains blocks with underlying arrays of components, the Simscape Results Explorer includes logged simulation data for the array members.
For example, in this model, the Resistor Array block contains an underlying array of resistors.

When you simulate this model, the Simscape Results Explorer tree includes nodes for the numbered array members, such
as resistor(1), resistor(2), and so on. If the
component array size is 1xN, the members are numbered
comp(1), …, comp(N). If the array size is
NxM, the members are numbered comp(1,1),
comp(1,2), …, comp(NxM).

Unlike regular blocks, clicking a node that represents a block with an underlying array of components does not display any plots. Click a node that represents an individual array member to see plots of all of its variables.
Related Examples
Version History
Introduced in R2014bYou can also select a web site from the following list:
Americas
- América Latina (Español)
- Canada (English)
- United States (English)
Europe
- Belgium (English)
- Denmark (English)
- Deutschland (Deutsch)
- España (Español)
- Finland (English)
- France (Français)
- Ireland (English)
- Italia (Italiano)
- Luxembourg (English)
- Netherlands (English)
- Norway (English)
- Österreich (Deutsch)
- Portugal (English)
- Sweden (English)
- Switzerland
- United Kingdom (English)