Find Periodicity in a Categorical Time Series
This example shows how to perform spectral analysis of categorical-valued time-series data. The spectral analysis of categorical-valued time series is useful when you are interested in cyclic behavior of data whose values are not inherently numerical. This example reproduces in part the analysis reported in Stoffer et al. (1988). The data are taken from Stoffer, Tyler, and Wendt (2000).
The data are from a study of sleep states in newborn children. A pediatric neurologist scored an infant's electroencephalographic (EEG) recording every minute for approximately two hours. The neurologist categorized the infant's sleep state into one of the following:
qt- Quiet sleep, trace alternantqh- Quiet sleep, high voltagetr- Transitional sleepal- Active sleep, low voltageah- Active sleep, high voltageaw- Awake
Enter the data. The infant was never awake during the EEG recording.
data = {'ah','ah','ah','ah','ah','ah','ah','ah','tr','ah','tr','ah', ...
   'ah','qh','qt','qt','qt','qt','qt','tr','qt','qt','qt','qt','qt', ...
   'qt','qt','qt','qt','qt','tr','al','al','al','al','al','tr','ah', ...
   'al','al','al','al','al','ah','ah','ah','ah','ah','ah','ah','tr', ...
   'tr','ah','ah','ah','ah','tr','tr','tr','qh','qh','qt','qt','qt', ...
   'qt','qt','qt','qt','qt','qt','qt','qt','qt','qt','qt','qt','qt', ...
   'qt','qt','tr','al','al','al','al','al','al','al','al','al','al', ...
   'al','al','al','al','al','al','al','ah','ah','ah','ah','ah','ah', ...
   'ah','ah','ah','tr'};

lend = length(data);
t = 1:lend;
The easiest way to analyze categorical-valued time series data for cyclic patterns involves assigning numerical values to the categories. There are at least two meaningful ways of assigning values to the infant's sleep states. First, note that you can order the six states from 1 to 6. This assignment makes sense along the scale of least active to most active.
Replace the six sleep states with their numerical equivalents and plot the data.
states = ['qt';'qh';'tr';'al';'ah';'aw'];
levelssix = [1 2 3 4 5 6];

for nn = 1:6
    datasix(strcmp(data,states(nn,:))) = levelssix(nn);
end

plot(t,datasix)
axis([0 lend 0 6])
ax = gca;
ax.YTick = [1 2 4 5];
grid
xlabel('Minutes')
ylabel('Sleep State')
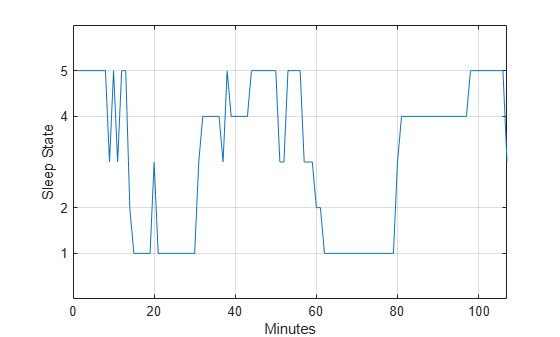
The data exhibit cyclic behavior when you focus on the transitions between the quietest states (1 and 2) and the most active ones (4 and 5). To determine the cycle of that behavior, use spectral analysis. Recall that the sleep states are assigned in one-minute intervals. Sampling the data in one-minute intervals is equivalent to sampling the data 60 times per hour.
Fs = 60;
[Pxx,F] = periodogram(detrend(datasix,0),[],240,Fs);

plot(F,Pxx)
grid
xlabel('Cycles/Hour')
title('Periodogram of Sleep States')
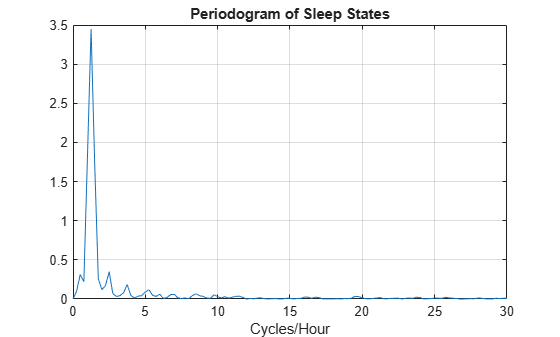
The spectral analysis shows a clear peak indicating a dominant oscillation, or cycle in the data. Determine the frequency of the peak.
[~,maxidx] = max(Pxx);
Fsix = F(maxidx)
Fsix =
1.2500
The infant's sleep states exhibit cyclic behavior with a frequency of approximately 1.25 cycles/hour.
Instead of assigning the sleep states the values 1 to 6, repeat the analysis focusing only on the distinction between quiet and active sleep. Assign the quiet states, qt and qh, the value 1. Assign the transitional state, tr, the value 2. Finally, assign the two active sleep states, al and ah, the value 3. For completeness, assign the awake state, aw, the value 4, even though the state does not occur in the data.
states = ['qt';'qh';'tr';'al';'ah';'aw'];
levelsfou = [1 1 2 3 3 4];

for nn = 1:6
    datafou(strcmp(data,states(nn,:))) = levelsfou(nn);
end

plot(t,datafou)
axis([0 lend 0 4])
ax = gca;
ax.YTick = [1 2 3];
grid
xlabel('Minutes')
ylabel('Sleep State')
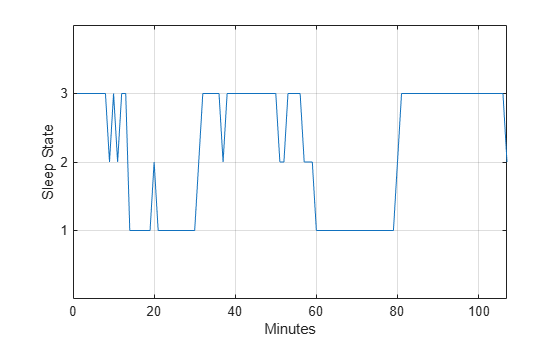
With this rule of assignment between the sleep states and the values 1 to 3, the cyclic behavior of the data is clearer. Repeat the spectral analysis with the new assignment.
[Pxx,F] = periodogram(detrend(datafou,0),[],240,Fs);

plot(F,Pxx)
grid
xlabel('Cycles/Hour')
title('Periodogram of Sleep States')
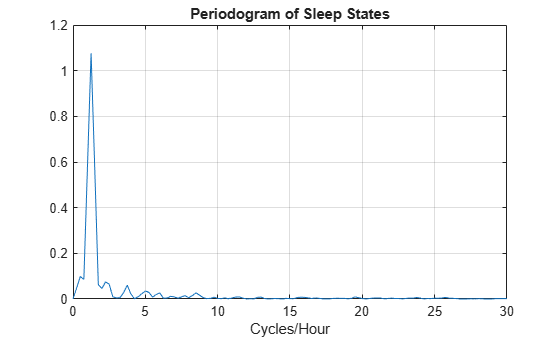
[maxval,maxidx] = max(Pxx);
F(maxidx)
ans =
1.2500
The new assignment has not changed the conclusion. The data show a dominant oscillation at 1.25 cycles/hour. Because the mapping between the sleep states and the integers representing those states was consistent, the analysis and conclusions were not affected. Based on a spectral analysis of this categorical data, you conclude that the infant's sleep state cycles between quiet and active sleep approximately once every hour.
References
Stoffer, David S., Mark S. Scher, Gale A. Richardson, Nancy L. Day, and Patricia A. Coble. "A Walsh-Fourier Analysis of the Effects of Moderate Maternal Alcohol Consumption on Neonatal Sleep-State Cycling." Journal of the American Statistical Association. Vol. 83, 1988, pp. 954-963.
Stoffer, David S., D. E. Tyler, and D. A. Wendt. "The Spectral Envelope and Its Applications." Statistical Science. Vol. 15, 2000, pp. 224-253.