Find a Signal in a Measurement
You receive some data and would like to know if it matches a longer stream you have measured. Cross-correlation allows you to make that determination, even when the data are corrupted by noise.
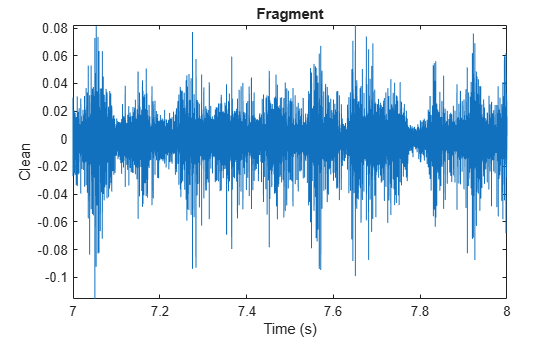
Load into the workspace a recording of a ring spinning on a tabletop. Crop a one-second fragment and listen to it.
load('Ring.mat')

Time = 0:1/Fs:(length(y)-1)/Fs;

m = min(y);
M = max(y);

Full_sig = double(y);

timeA = 7;
timeB = 8;
snip = timeA*Fs:timeB*Fs;

Fragment = Full_sig(snip);

% To hear, type soundsc(Fragment,Fs)
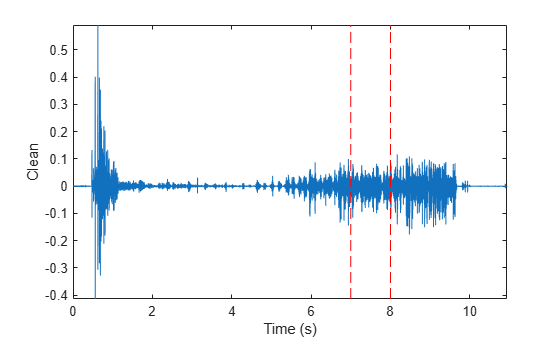
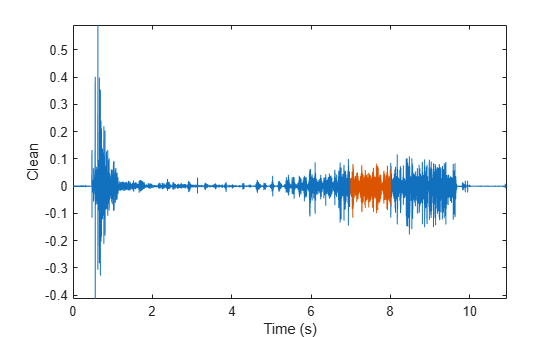
Plot the signal and the fragment. Highlight the fragment endpoints for reference.
plot(Time,Full_sig,[timeA timeB;timeA timeB],[m m;M M],'r--')
xlabel('Time (s)')
ylabel('Clean')
axis tight
plot(snip/Fs,Fragment)
xlabel('Time (s)')
ylabel('Clean')
title('Fragment')
axis tight
Compute and plot the cross-correlation of the full signal and the fragment.
[xCorr,lags] = xcorr(Full_sig,Fragment);

plot(lags/Fs,xCorr)
grid
xlabel('Lags (s)')
ylabel('Clean')
axis tight
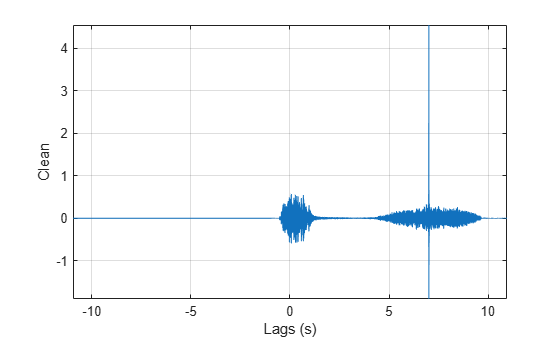
The lag at which the cross-correlation is greatest is the time delay between the signals' starting points. Replot the signal and overlay the fragment.
[~,I] = max(abs(xCorr));
maxt = lags(I);

Trial = NaN(size(Full_sig));
Trial(maxt+1:maxt+length(Fragment)) = Fragment;

plot(Time,Full_sig,Time,Trial)
xlabel('Time (s)')
ylabel('Clean')
axis tight
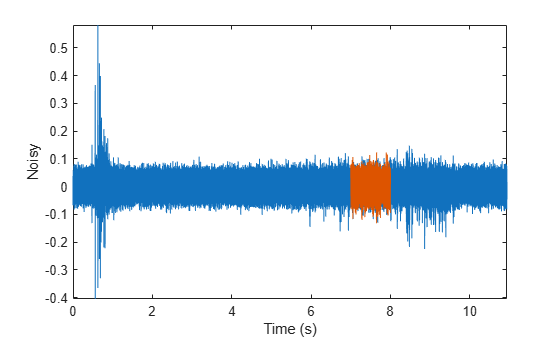
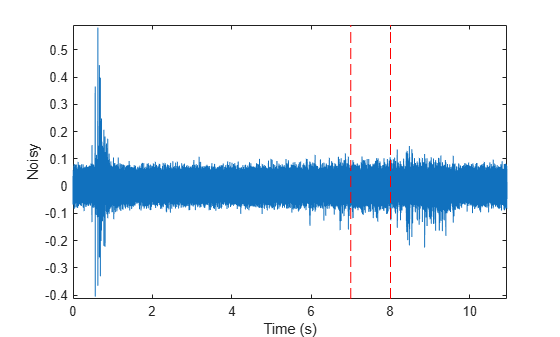
Repeat the procedure, but add noise separately to signal and fragment. The sound cannot be picked out from the noise.
NoiseAmp = 0.2*max(abs(Fragment));

Fragment = Fragment+NoiseAmp*randn(size(Fragment));

Full_sig = Full_sig+NoiseAmp*randn(size(Full_sig));

% To hear, type soundsc(Fragment,Fs)

plot(Time,Full_sig,[timeA timeB;timeA timeB],[m m;M M],'r--')
xlabel('Time (s)')
ylabel('Noisy')
axis tight
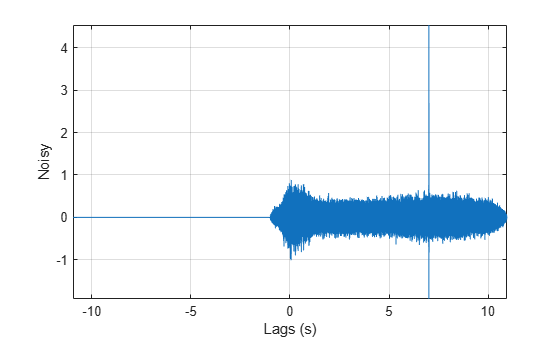
The procedure finds the missing fragment despite the high noise level.
[xCorr,lags] = xcorr(Full_sig,Fragment);

plot(lags/Fs,xCorr)
grid
xlabel('Lags (s)')
ylabel('Noisy')
axis tight
[~,I] = max(abs(xCorr));
maxt = lags(I);

Trial = NaN(size(Full_sig));
Trial(maxt+1:maxt+length(Fragment)) = Fragment;

figure
plot(Time,Full_sig,Time,Trial)
xlabel('Time (s)')
ylabel('Noisy')
axis tight