Cross-Correlation of Two Exponential Sequences
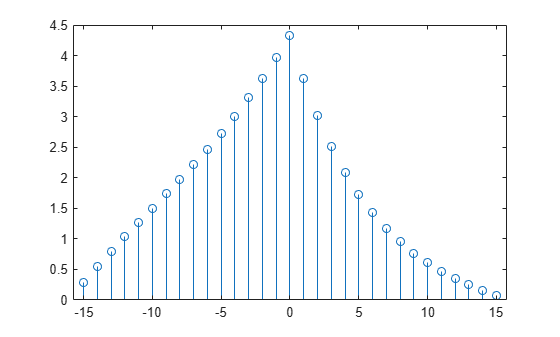
Compute and plot the cross-correlation of two 16-sample exponential sequences, and , with .
N = 16;
n = 0:N-1;

a = 0.84;
b = 0.92;

xa = a.^n;
xb = b.^n;

r = xcorr(xa,xb);

stem(-(N-1):(N-1),r)
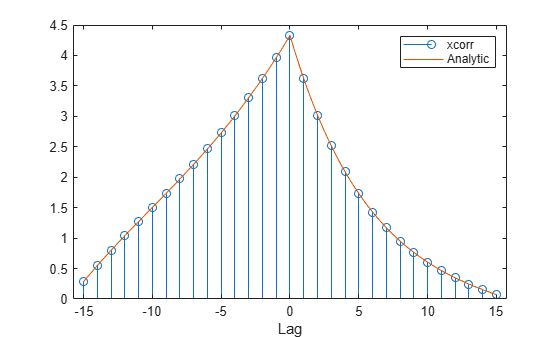
Determine analytically to check the correctness of the result. Use a larger sample rate to simulate a continuous situation. The cross-correlation function of the sequences and for , with , is
fs = 10;
nn = -(N-1):1/fs:(N-1);

cn = (1 - (a*b).^(N-abs(nn)))/(1 - a*b) .* ...
     (a.^nn.*(nn>0) + (nn==0) + b.^-(nn).*(nn<0));
Plot the sequences on the same figure.
hold on
plot(nn,cn)

xlabel('Lag')
legend('xcorr','Analytic')
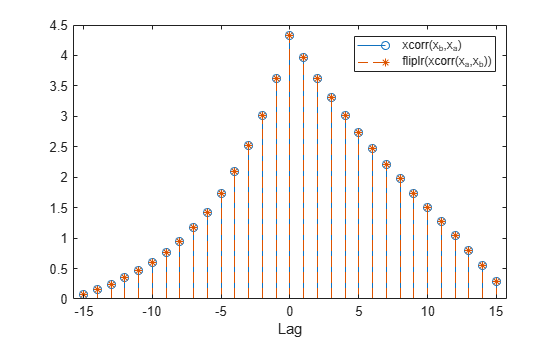
Verify that switching the order of the operands reverses the sequence.
figure

stem(-(N-1):(N-1),xcorr(xb,xa))

hold on
stem(-(N-1):(N-1),fliplr(r),'--*')

xlabel('Lag')
legend('xcorr(x_b,x_a)','fliplr(xcorr(x_a,x_b))')
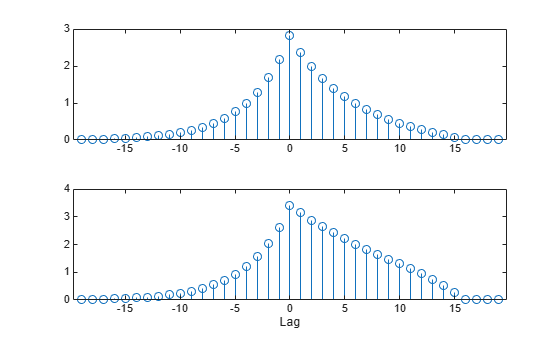
Generate the 20-sample exponential sequence . Compute and plot its cross-correlations with and . Output the lags to make the plotting easier. xcorr appends zeros at the end of the shorter sequence to match the length of the longer one.
xc = 0.77.^(0:20-1);

[xca,la] = xcorr(xa,xc);
[xcb,lb] = xcorr(xb,xc);

figure

subplot(2,1,1)
stem(la,xca)
subplot(2,1,2)
stem(lb,xcb)
xlabel('Lag')