Monitor Polyspace Access Performance
You can query Polyspace® Access™ for various metrics related to user activity, background processes, and database usage. You can use these metrics to monitor the health of the Polyspace Access server, identify trends and potential issues, and optimize server performance and reliability.
To query Polyspace
Access for the server metrics, use the polyspace/api/monitoring endpoint. For example, if the Polyspace
Access instance runs on a machine with hostname access-example-server on port 9443, use this URL:
http(s)://access-example-server:9443/polyspace/api/monitoring
Server Metrics Format and Description
When you query Polyspace Access for server metrics, the server returns data in a human-readable Prometheus text-based format that you can easily integrate with a server performance monitoring platform. For more on the text-based Prometheus format, see Text-based format.
![]() Sample Polyspace
Access Server Response
Sample Polyspace
Access Server Response
This table describes the metrics that Polyspace Access returns.
| Metric | Description |
|---|---|
psaccess_db_size_bytes | Size numBytes of the Polyspace
Access database in bytes. |
| Number of projects numProjects currently stored in Polyspace
Access. If active="false" the number represents projects that are waiting for deletion in the ProjectsWaitingForDeletion folder. Projects in this folder are visible only to Polyspace Access administrators. |
| Number of runs numRuns currently stored in Polyspace
Access. If active="false" the number represents runs that are waiting for deletion in the ProjectsWaitingForDeletion folder. Runs in this folder are visible only to Polyspace
Access administrators. |
psaccess_users_connected_total | Number of users Polyspace counts only unique username logins. If the same user is logged in from two different devices or web browsers, it counts as one user login. |
psaccess_jobs_queued_total{type="upload | review_transfer | download | project_deletion"} | Number of jobs
|
psaccess_jobs_processing_total{type="upload | review_transfer | download | project_deletion"} | Number of jobs numJobs that Polyspace
Access is currently processing. See the description of psaccess_jobs_queued_total for an explanation of the job type. |
psaccess_jobs_completed_total{type="upload | review_transfer | download | project_deletion"} | Number of jobs numJobs that Polyspace
Access processed successfully. See the description of psaccess_jobs_queued_total for an explanation of the job type. |
psaccess_jobs_failed_total{type="upload | review_transfer | download | project_deletion"} | Number of jobs numJobs that failed to complete. See the description of psaccess_jobs_queued_total for an explanation of the job type. |
psaccess_jobs_queued_delay_seconds{type="upload | review_transfer | download | project_deletion"} | Age queueAge in seconds of the oldest job in the queue. See the description of psaccess_jobs_queued_total for an explanation of the job type. |
psaccess_jobs_processing_delay_seconds{type="upload | review_transfer | download | project_deletion"} | Age jobAge in seconds of the oldest job that Polyspace
Access is currently processing. See the description of psaccess_jobs_queued_total for an explanation of the job type. |
Create Grafana Dashboard to Monitor Polyspace Access
This example shows how to configure a Prometheus® data source to query Polyspace Access for server metrics and visualize the metrics in a Grafana® dashboard.
Prerequisites
A Grafana installation. For example, to run Grafana in Docker® container. See Grafana Docker Image.
A Prometheus data source. For example, you can run Prometheus on Docker. See Prometheus Docker container.
Configure Prometheus Data Source
To configure Prometheus to scrape data from a target such as Polyspace
Access, you use a YAML file where you specify the URL of the target, the HTTP endpoint used to query the metrics, and other parameters. Typically, the file is called prometheus.yml.
This sample YAML file shows a configuration for a Polyspace
Access instance which runs on a machine with hostname access-example-server using the default Polyspace
Access port (9443).
Note
This sample configuration disables the validation of the server certificate (insecure_skip_verify), which is not recommended in a typical configuration.
global:
  # How frequently to scrape targets by default.
  scrape_interval: 15s

  # How long until a scrape request times out.
  scrape_timeout: 5s

scrape_configs:
  - job_name: "polyspace"
    tls_config:
      insecure_skip_verify: true
    metrics_path: '/polyspace/api/monitoring'
    scheme: https
    static_configs:
- targets: ["access-example-server:9443"]scrape_config section to add the Polyspace
Access parameters.After you create or edit your prometheus.yml file, restart your Prometheus instance to apply the changes and check that Prometheus is able to scrape the endpoint polyspace/api/monitoring. To view the status of scraped target, go to the /targets page of your Prometheus server web UI (for example http://localhost:9090/targets). If Prometheus is able to scrape the endpoint, you see something similar to this:

Add Prometheus Data Source and Create Dashboard
To start monitoring your Polyspace Access server, add the Prometheus instance you configured in the previous section as a data source to Grafana. See Add a data source.
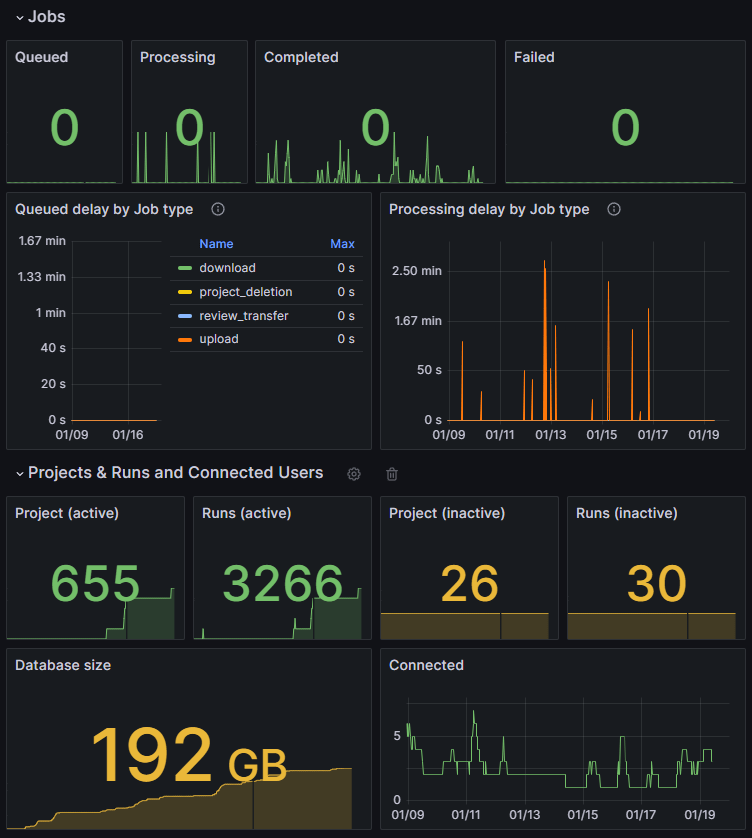
You can then create a dashboard to visualize the Polyspace Access server metrics or edit an existing dashboard to monitor Polyspace Access along with other tools. To create a dashboard, see Create a dashboard.
To view additional metrics about Polyspace Access, such as CPU usage or the performance characteristics of the different Polyspace Access docker containers, you can use external tools to export that data and then integrate it in your dashboard. For a list of libraries and server that export data as Prometheus metrics, see Exporters and Integrations.