Using the Polyspace as You Code Views in Visual Studio Code
The Polyspace® as You Code™ extension has a dedicated perspective in Visual Studio Code that groups all the relevant Polyspace views.
Click the Polyspace button ![]() in the Visual Studio Code sidebar to open the Polyspace sidebar. The Polyspace
as You Code sidebar displays information about your configuration, analysis, and
results in the following views:
in the Visual Studio Code sidebar to open the Polyspace sidebar. The Polyspace
as You Code sidebar displays information about your configuration, analysis, and
results in the following views:
Configuration
Quality Monitoring
Headers
Error List
Result Details
Baseline
Configuration View
The Configuration view shows your current Analysis Options settings and the status of the generated build options file, if applicable.
In this view, you can:
Click
 to open the Checkers selection
window. See Visual Studio Code: Configure Checkers and Coding Rules in Polyspace as You Code.
to open the Checkers selection
window. See Visual Studio Code: Configure Checkers and Coding Rules in Polyspace as You Code.Click
 to configure analysis options. See
Configure Analysis Settings.
to configure analysis options. See
Configure Analysis Settings.View your current build settings and build options status. See Visual Studio Code: Generate Build Options for Polyspace as You Code.
Click
 to toggle on or off fast analysis
mode.
to toggle on or off fast analysis
mode.Click
 to sign into your MathWorks® account. This is a requirement to use Polyspace Copilot in Polyspace
as You Code.
to sign into your MathWorks® account. This is a requirement to use Polyspace Copilot in Polyspace
as You Code.Click
 to open the Polyspace documentation.
Quality Monitoring View
The Quality Monitoring view displays each file that you have selected for analysis in a list along with the status of the analysis, the number of results for each file, and which baselines are associated with the file.
You can manually add a file to the Quality Monitoring list or have Polyspace automatically add a file to the Quality Monitoring list when you save a file.
To add a file manually, right-click the file in the editor or in the Explorer view and select Add file to the Polyspace Quality Monitoring list.
To add files automatically, click the
icon to open the
Settingswindow and then select the checkbox for Analysis Options: Add To Quality Monitoring On Save. See Configure Analysis Behavior on Save.
To manually start an analysis, hover over a file in the Quality Monitoring list
and select the Run Polyspace Analysis ![]() icon. You can also start a sequential
file-by-file analysis of all files in the Quality Monitoring list by clicking the
icon. You can also start a sequential
file-by-file analysis of all files in the Quality Monitoring list by clicking the ![]() icon.
icon.
If you remove a file from the Quality Monitoring view after you have run an analysis on that file, Polyspace removes the results associated with that file as well as all the included files. If you add the removed file back to the Quality Monitoring view, no results are associated with the file until you run a new analysis.
Hover over a file in the Quality Monitoring list to view which local or Polyspace Access baselines are associated with that file. If a Polyspace Access baseline is associated with the file, the name of the Polyspace Access project the baseline is from is displayed.
Headers view
When you analyze a file, Polyspace also analyzes the header files that are included by the file and that
are in the same folder as the file. If Polyspace reports results in a header file, you see an H next
to the analyzed file in the Quality Monitoring view. Click the
analyzed file in the Quality Monitoring view to display all
associated analyzed header files in Headers view.
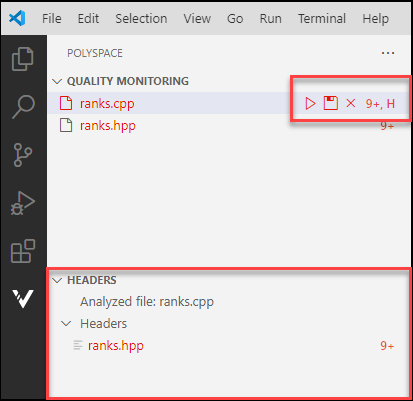
Header files show in the list only if they contain results. Click the file in the Headers view to open its results in the Problems view.
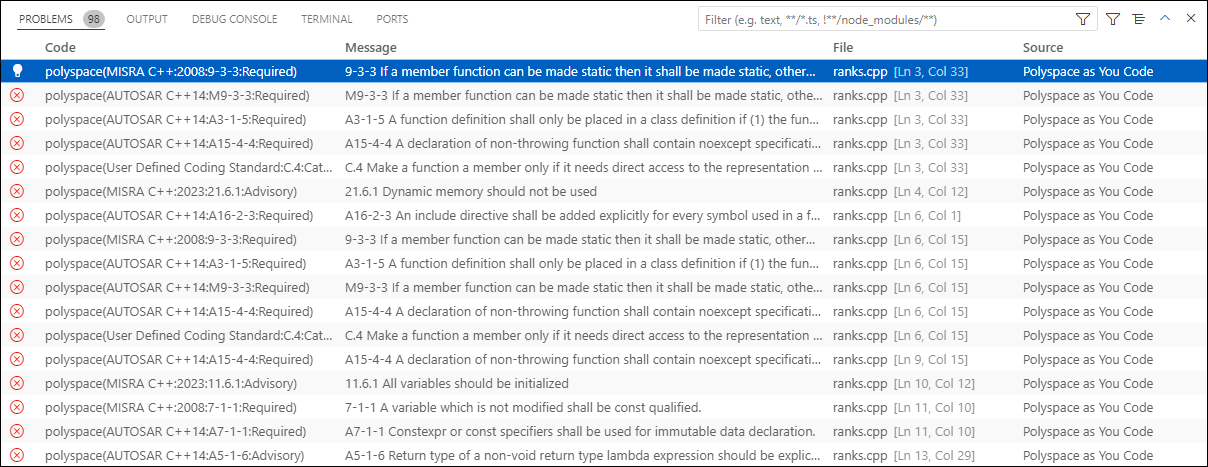
Problems View
The Problems view shows the all the analysis results, listed one result per line. Each line shows additional information, such as:
The name of the defect or coding rule, family, and description
Name of the file containing the result
Review information
The results are grouped by file. Use the filters in the right side corner of the Problems view to narrow your review focus. You can change the Problems view to show results in a tree format or a table format. If a message is too long, right-click the message and select Copy Message to copy the message to your system clipboard for pasting into any text editor.
The results that show in the Problems view represent the results for the files that you select in the Quality Monitoring view. The number of results in the Problems view can change and does not represent results for all analyzed files.
When you select a file in the Quality Monitoring view, in the Problems view you see results from:
Each file listed in the Quality Monitoring view including the selected file.
The header files of the file you select in the Quality Monitoring view.
If you select a different file in the Quality Monitoring view:
Polyspace removes the previously selected file's header file results from the Problems view.
The newly selected file's header file results show in the Problems view.
Result Details View
When you select a result in the Problems view or in the editor, the Result Details view shows additional information about the result. This includes the rule definition of the violation, the location of the violation in your code, any traceback information when available, and the review information imported from the baseline. If you select multiple lines of code, the Result Details view shows the result details for all the results in the selection.
Select a result and click the ![]() icon to view contextual help about that
result.
icon to view contextual help about that
result.
To lock the view and keep it from updating when you browse through results in the
source code or the Problems view, click the ![]() icon in the upper right. To unlock the view,
click
icon in the upper right. To unlock the view,
click ![]() .
.
Baseline View
The Baseline view shows any local baselines and any baselines you have downloaded from Polyspace Access™ results.
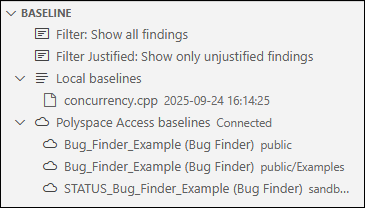
In this view, you can:
Click the filter
 icon to enable or disable filtering
the Problems view to show only results that are new
when compared to a baseline.
icon to enable or disable filtering
the Problems view to show only results that are new
when compared to a baseline.Click the
 icon on the
 Local baselinesline to create a local baseline for all files currently in the quality monitoring list. Click the icon to update all local baselines or
the
icon to update all local baselines or
the  icon to remove a local
baseline.
icon to remove a local
baseline.Click
to open and edit the Polyspace
Access baseline settings.Click
 to download or update your
Polyspace
Access baselines.
to download or update your
Polyspace
Access baselines.Click
 to open the baseline project in the
Polyspace
Access interface.
to open the baseline project in the
Polyspace
Access interface.Click
next to the name of the baseline to
remove the baseline.
Polyspace as you Code monitors your baselines to verify the run ID of the baseline
matches the latest run ID in Polyspace Access. You can hover over a baseline to view
details such as the run ID the baseline uses and the status of the baseline.
Baselines that have never been downloaded or are outdated appear in yellow text in
the Baseline pane. Baselines that are outdated also display the
outdated icon ![]() in the Baseline pane. To
keep using the most up-to-date baseline, periodically update your baselines by
downloading the latest results from Polyspace Access.
in the Baseline pane. To
keep using the most up-to-date baseline, periodically update your baselines by
downloading the latest results from Polyspace Access.
If the results from the baseline run are generated with a Polyspace version that is older than your Polyspace as You Code version, the Baseline view shows a warning.
For more information on creating baselines and connecting to Polyspace Access with Polyspace as You Code, see Visual Studio Code: Configure Baseline Results in Polyspace as You Code.
See Also
Topics
- Visual Studio Code: Configure Polyspace as You Code Extension
- Visual Studio Code: Generate Build Options for Polyspace as You Code
- Visual Studio Code: Configure Baseline Results in Polyspace as You Code
- Visual Studio Code: Configure Checkers and Coding Rules in Polyspace as You Code
- Run Polyspace as You Code in Visual Studio Code and Review Results