Analyze GNSS Satellite Visibility
This example shows how to simulate and analyze GNSS satellite visibility at specified receiver positions and times using a GNSS/GPS ephemeris or almanac file. Use the live script controls to set various parameters for the satellite simulation.
Specify Simulation Parameters
Specify the navigation message file type, start time, duration in hours, and time between samples in seconds of the simulation. Also, specify the position of the receiver in geodetic coordinates and the mask angle, or minimum elevation angle, of the receiver.
gnssFileType ="RINEX"; startTime = datetime(2021,06,24,04,00,00); numHours =
24; dt =
60; % s latitude =
42.3013162; % deg longitude =
-71.3782972; % deg altitude =
50; % m recPos = [latitude longitude altitude]; % [deg deg m] maskAngle =
5; % deg
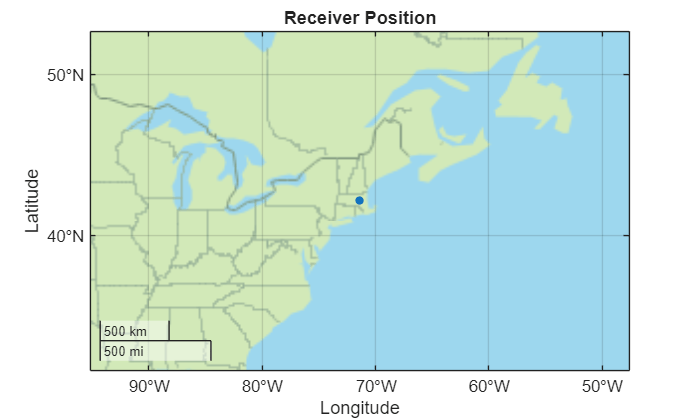
Display the GNSS receiver position.
geoplot(latitude,longitude,"x")
title("Receiver Position")
If using RINEX Navigation Message files, select the GNSS satellite system to analyze.
satSys = "GPS"; if gnssFileType == "RINEX" satSys ="GPS"; end
Get Satellite Orbital Parameters
Use the exampleHelperParseGNSSFile helper function to obtain the initial satellite orbital parameters and satellite IDs from a GNSS file. The GPS, Galileo, BeiDou, NavIC, and QZSS ephemeris data is valid for two hours before and after the time of ephemeris. The GLONASS and SBAS ephemeris data is valid for 15 minutes before and after the time of ephemeris. In those valid time windows, you can use the ephemeris data with the gnssconstellation function as an orbit propagator to determine the positions of the satellites in orbit with high precision. In contrast, while almanac data, is valid for a period of 90 days, you can only use it for estimating the approximate positions of the satellites.
[navmsg,satIDs] = exampleHelperParseGNSSFile(gnssFileType,satSys);
The files used in this example are tied to the specified start time startTime. To use different RINEX files, use the RINEX files included in the Read Navigation and Observation Data from RINEX File example. For examples of how to download and use different SEM and YUMA almanac files, see the Read GPS Navigation Message Data from SEM Almanac File and Read GPS Navigation Message Data from YUMA Almanac File, respectively.
Other orbit propagators are available in the satelliteScenario object.
Once you have new ephemeris data or an almanac file, update the file variable of the exampleHelperParseGNSSFile helper function for the case that corresponds to your file type.
Generate Satellite Visibilities
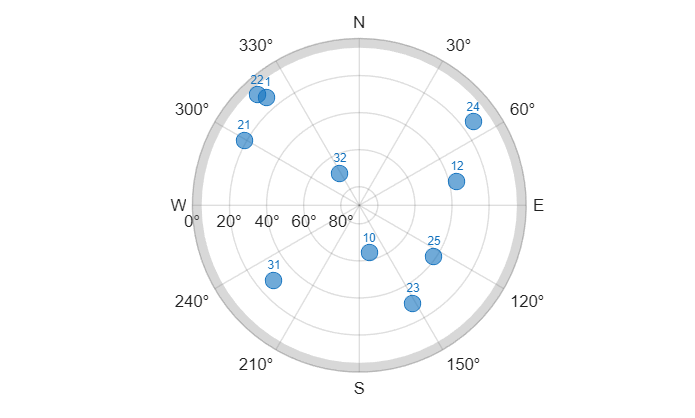
First, get the satellite positions and a matrix of logical values that determine their visibility at startTime. Plot the visible satellites using skyplot.
satPos = gnssconstellation(startTime,navmsg,GNSSFileType=gnssFileType);
[az,el,vis] = lookangles(recPos,satPos,maskAngle);
figure
skyplot(az(vis),el(vis),satIDs(vis),MaskElevation=maskAngle);
Note that the visibility of the satellites is determined from the WGS 84 ellipsoid reference and the maskAngle elevation cutoff. To simulate GNSS satellite visibilities while accounting for local terrain and obstructions, refer to the Simulate GNSS Multipath Effects on UAV Flying in Urban Environment and Simulate GNSS Multipath Effects in Urban Canyon Environment examples.
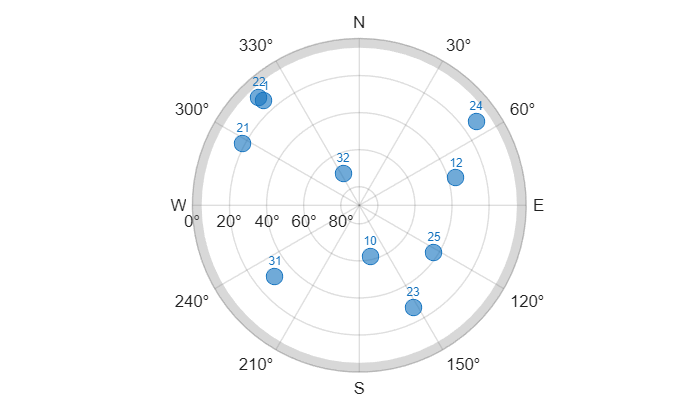
Next, using your simulation parameters, generate the satellite visibilities as a matrix of logical values. Each row in the matrix corresponds to a time step, and each column corresponds to a satellite. To plot visibilities, iterate through the time vector while calculating the satellite positions and look angles based on the GNSS constellation simulation.
secondsPerHour = 3600;
timeElapsed = 0:dt:(secondsPerHour*numHours);
t = startTime+seconds(timeElapsed);

numSats = numel(satIDs);
numSamples = numel(t);
az = zeros(numSamples,numSats);
el = zeros(numSamples,numSats);
vis = false(numSamples,numSats);

sp = skyplot([],[],MaskElevation=maskAngle);

for ii = 1:numel(t)
    satPos = gnssconstellation(t(ii),navmsg,GNSSFileType=gnssFileType);
    [az(ii,:),el(ii,:),vis(ii,:)] = lookangles(recPos,satPos,maskAngle);
    set(sp,AzimuthData=az(ii,vis(ii,:)), ...
        ElevationData=el(ii,vis(ii,:)), ...
        LabelData=satIDs(vis(ii,:)))
    drawnow limitrate
end
Plot Results
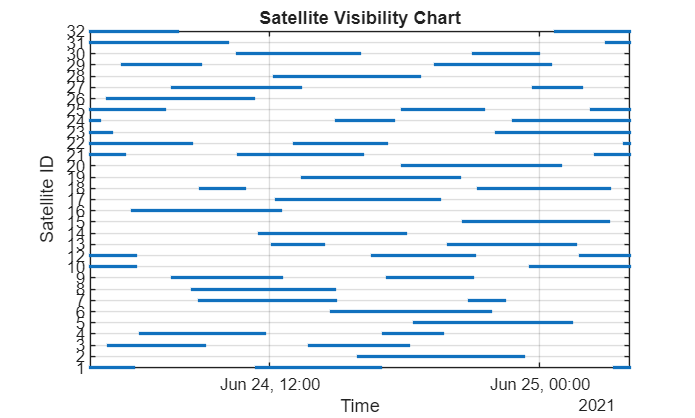
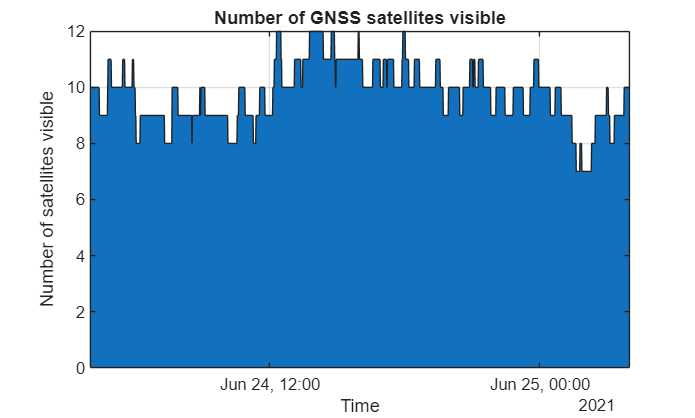
Use the logical matrix to generate a satellite visibility chart, and plot the total number of visible satellites at each time step. In general, at least four satellites must be visible to compute a positioning solution.
visPlotData = double(vis);
visPlotData(visPlotData == false) = NaN; % Hide invisible satellites.
visPlotData = visPlotData + (0:numSats-1); % Add space to satellites to be stacked.
colors = colororder;

figure
plot(t,visPlotData,".",Color=colors(1,:))
yticks(1:numSats)
yticklabels(string(satIDs))
grid on
ylabel("Satellite ID")
xlabel("Time")
title("Satellite Visibility Chart")
axis tight
numVis = sum(vis,2);
figure
area(t,numVis)
grid on
xlabel("Time")
ylabel("Number of satellites visible")
title("Number of GNSS satellites visible")
axis tight
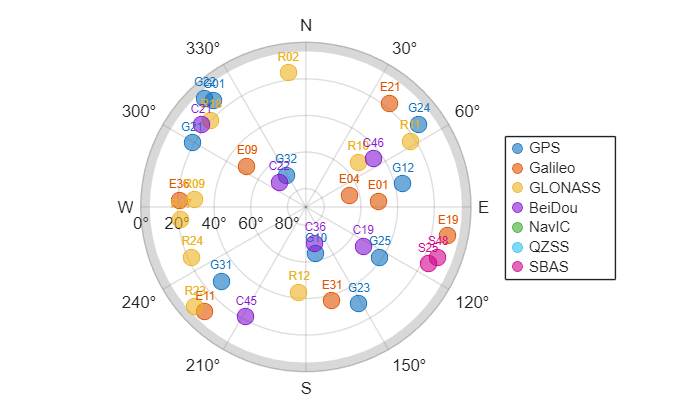
Multi-Constellation Visibilities
Some GNSS receivers use multiple satellite systems to compute the position solution. To determine the visibility of multiple satellite systems, use the startTime, recPos, and maskAngle simulation parameters and a RINEX navigation message file for each of the GNSS satellite systems.
allSatSys = ["GPS","Galileo","GLONASS","BeiDou","NavIC","QZSS","SBAS"];
satLetter = ["G","E","R","C","I","J","S"];

sp = skyplot([],[],MaskElevation=maskAngle);

for ii = 1:numel(allSatSys)
    satSys = allSatSys(ii);

    % Get the satellite positions of the current satellite system.
    [navmsg,satIDs] = exampleHelperParseGNSSFile("RINEX",satSys);
    satPos = gnssconstellation(startTime,navmsg);
    [az,el,vis] = lookangles(recPos,satPos,maskAngle);

    % Combine the satellite system symbol letter with the satellite ID.
    satIDLabel = arrayfun(@(x) sprintf("%c%02d",satLetter(ii),x),satIDs);

    % Create a categorical array to associate the current values with the
    % current satellite system in the skyplot.
    satGroup = categorical(repmat(ii,numel(satIDLabel),1),1:numel(allSatSys),allSatSys);

    % Update the skyplot.
    set(sp, ...
        AzimuthData=[sp.AzimuthData(:); az(vis)], ...
        ElevationData=[sp.ElevationData(:); el(vis)], ...
        LabelData=[sp.LabelData(:); satIDLabel(vis)], ...
        GroupData=[sp.GroupData; satGroup(vis)]);
end

% Add a legend to the skyplot.
legend
Helper Function
Use the exampleHelperParseGNSSFile helper function to obtain the initial satellite orbital parameters and satellite IDs from the GNSS file, based on the file type.
function [navmsg,satIDs] = exampleHelperParseGNSSFile(gnssFileType,satSys)
    switch gnssFileType
        case "RINEX"
            switch satSys
                case "GPS"
                    file = "GODS00USA_R_20211750000_01D_GN.rnx";
                    navmsg = rinexread(file);
                    % For RINEX files, extract GPS data and use only the first entry for each satellite.
                    gpsData = navmsg.GPS;
                    [~,idx] = unique(gpsData.SatelliteID);
                    navmsg = gpsData(idx,:);
                case "Galileo"
                    file = "GODS00USA_R_20211750000_01D_EN.rnx";
                    navmsg = rinexread(file);
                    % For RINEX files, extract Galileo data and use only the first entry for each satellite.
                    galData = navmsg.Galileo;
                    [~,idx] = unique(galData.SatelliteID);
                    navmsg = galData(idx,:);
                case "GLONASS"
                    file = "GODS00USA_R_20211750000_01D_RN.rnx";
                    navmsg = rinexread(file);
                    % For RINEX files, extract GLONASS data and use only the first entry for each satellite.
                    gloData = navmsg.GLONASS;
                    [~,idx] = unique(gloData.SatelliteID);
                    navmsg = gloData(idx,:);
                case "BeiDou"
                    file = "GODS00USA_R_20211750000_01D_CN.rnx";
                    navmsg = rinexread(file);
                    % For RINEX files, extract BeiDou data and use only the first entry for each satellite.
                    bdsData = navmsg.BeiDou;
                    [~,idx] = unique(bdsData.SatelliteID);
                    navmsg = bdsData(idx,:);
                case "NavIC"
                    file = "ARHT00ATA_R_20211750000_01D_IN.rnx";
                    navmsg = rinexread(file);
                    % For RINEX files, extract NavIC data and use only the first entry for each satellite.
                    irnData = navmsg.NavIC;
                    [~,idx] = unique(irnData.SatelliteID);
                    navmsg = irnData(idx,:);
                case "QZSS"
                    file = "ARHT00ATA_R_20211750000_01D_JN.rnx";
                    navmsg = rinexread(file);
                    % For RINEX files, extract QZSS data and use only the first entry for each satellite.
                    qzsData = navmsg.QZSS;
                    [~,idx] = unique(qzsData.SatelliteID);
                    navmsg = qzsData(idx,:);
                case "SBAS"
                    file = "GOP600CZE_R_20211750000_01D_SN.rnx";
                    navmsg = rinexread(file);
                    % For RINEX files, extract SBAS data and use only the first entry for each satellite.
                    sbaData = navmsg.SBAS;
                    [~,idx] = unique(sbaData.SatelliteID);
                    navmsg = sbaData(idx,:);
            end
            satIDs = navmsg.SatelliteID;
        case "SEM"
            file = "semalmanac_2021-6-22.al3";
            navmsg = semread(file);
            satIDs = navmsg.PRNNumber;
        case "YUMA"
            file = "yumaalmanac_2021-6-22.alm";
            navmsg = yumaread(file);
            satIDs = navmsg.PRN;
    end
end
You can also select a web site from the following list:
Americas
- América Latina (Español)
- Canada (English)
- United States (English)
Europe
- Belgium (English)
- Denmark (English)
- Deutschland (Deutsch)
- España (Español)
- Finland (English)
- France (Français)
- Ireland (English)
- Italia (Italiano)
- Luxembourg (English)
- Netherlands (English)
- Norway (English)
- Österreich (Deutsch)
- Portugal (English)
- Sweden (English)
- Switzerland
- United Kingdom (English)