View Server Instance Performance Metrics in Dashboard
In the MATLAB® Production Server™ on-premises dashboard, you can view metrics on the performance of a server instance. To view the metrics, from the leftmost navigation pane, select a server instance and then click the Performance tab.
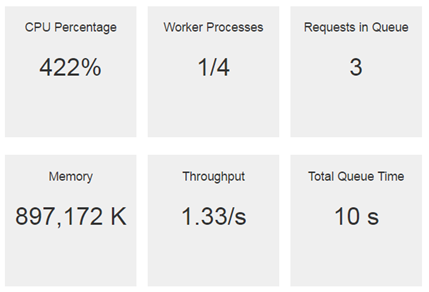
The Performance tab displays several metrics.

CPU Percentage — Percentage of the server machine’s CPU used by the instance. On a multi-core machine, this number can exceed 100% since it reports the cumulative CPU usage from all cores.
Worker Processes — Number of active workers processing requests compared to Maximum Workers configured in the Settings tab of an instance.
Requests In Queue — Number of requests waiting to be completed.
Memory — Amount of memory the instance is using.
Throughput — Request throughput.
Total Queue Time — Total processing latency in seconds.
You can view a plot of the Requests to Complete and Available Workers over time in the Activities graph. This graph shows sample data. You can adjust the timescale displayed in the graph.
