Set Up and Perform a Tradeoff Calibration
A tradeoff calibration is the process of filling lookup tables by balancing different objectives.
Typically there are many different and conflicting objectives. For example, a calibrator might want to maximize torque while restricting nitrogen oxides (NOX) emissions. It is not possible to achieve maximum torque and minimum NOX together, but it is possible to trade off a slight reduction in torque for a reduction of NOX emissions. Thus, a calibrator chooses the values of the input variables that produce this slight loss in torque over the values that produce the maximum value of torque.
This example takes you through the steps required for you to set up this tradeoff, and then to calibrate the lookup table for it.
Set Up a Tradeoff Calibration
Create a Tradeoff
Start CAGE by typing
cage
at the MATLAB® prompt.
Before you can calibrate the lookup tables, you must set up the calibration.
Select File > Open Project (or the toolbar button) to choose the
tradeoffInit.cagfile, found in thematlab\toolbox\mbc\mbctrainingfolder, then click OK.The
tradeoffInit.cagproject contains two models and all the variables necessary for this tutorial.To create a tradeoff calibration, select File > New > Tradeoff.
This takes you to the Tradeoff view.
Add Tables to a Tradeoff Calibration
The models of torque and NOX are in the current session. Add the lookup table to calibrate.
Both models have five inputs. The inputs for the torque and NOX models are
Exhaust gas recycling (EGR)
Air/fuel ratio (AFR)
Spark angle
Speed
Load
For this tutorial, you are interested in the spark angle over the range of speed and load.
To generate a lookup table for the spark angle,
Click
 (Add New Table) in the toolbar. This opens the
Create Lookup Table dialog box.
(Add New Table) in the toolbar. This opens the
Create Lookup Table dialog box.![Create Lookup Table dialog with name ‘Spark’, range [-Inf, Inf], rows input L (10 rows) and columns input N (13 columns). Two tables show input values and corresponding outputs for L (0.1 to 1) and N (1000 to 6500).](totut03.gif)
Enter
Sparkas the table Name.Check that
Nis the X input andLis the Y input.Enter
10as the size of the load axis (Rows).Enter
13as the size of the speed axis (Columns).Click OK to open the Table Setup dialog box
Click Select to open the Select Filling Item dialog box.
Select the option button Display variables, then select
SPKto fill the table and click OK.Click OK to close the Table Setup dialog box.
Before you can perform the calibration, you must display the models.
Display the Models
For this tutorial, you are comparing values of the torque and NOX models. Thus, you need to display these models.
To display both models:
Click
 Add Model to Display List in the toolbar
twice. This moves both available models into the Display
list.
Add Model to Display List in the toolbar
twice. This moves both available models into the Display
list.Alternatively, Shift-click to select both models in the Available Models list and click
 to include both models in the current display.
In this case, you want to include all available models. You can
click to select particular models in the list to display.
to include both models in the current display.
In this case, you want to include all available models. You can
click to select particular models in the list to display.
The Display Models pane following shows both models selected for display.
Perform the Tradeoff Calibration
You now fill the lookup table for spark angle by trading off gain in torque for reduction in NOX emissions.
The method that you use to fill the lookup table is
Obtain the maximum possible torque.
Restrict NOX to below 250 g/hr at any operating point.
Once you have completed the calibration, you can export the calibration for use in the electronic control unit.
Check the Normalizers
A normalizer is the axis of the lookup table (which is the collection of breakpoints). The breakpoints of the normalizers are automatically spaced over the ranges of speed and load. These define the operating points that form the cells of the tradeoff table.
Expand the Tradeoff tree by clicking the plus sign in the display, so you can
see the Spark table and its normalizers
Speed and Load. Click to highlight
either normalizer to see the normalizer view. A tradeoff calibration does not
compare the model and the table directly, so you cannot space the breakpoints by
reference to the model.
Set Values for Other Variables
At each operating point, you must fill the values of the spark table. Both of
the models depend on spark, AFR (labeled A, in the session),
and EGR (labeled E in the session). You could set the values
for AFR and EGR individually for each operating point in the table, but for
simplicity you set constant values for these model inputs.
To set constant values of AFR and EGR for all operating points,
Click Variable Dictionary in the Data Objects pane.
Click
Aand edit the Set Point to14.3, the stoichiometric constant, and press Enter.Click
Eand change the Set Point to0and press Enter.You have set these values for every operating point in your tradeoff table. You can now fill the spark angle lookup table. The process is described next.
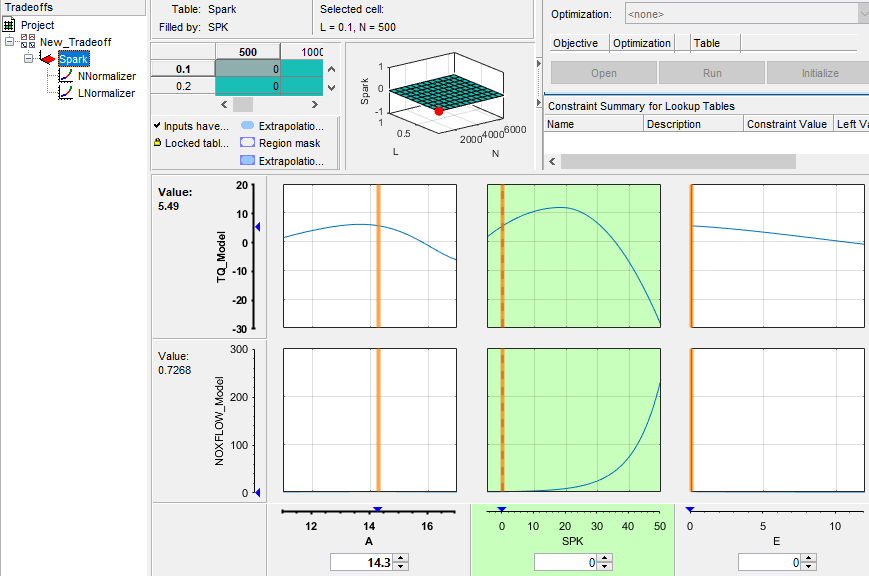
Click Tradeoff in the Processes pane to return to the tradeoff view.
Highlight the
Sparktable node in the Tradeoff tree display.In the lower pane, check that the value for
Ais14.3, and the value forEis0, as shown in the following example. You leave these values unchanged for each operating point.
For each operating point, you change the values of spark to trade off the torque and NOX objectives; that is, you search for the best value of spark that gives acceptable torque within the emissions constraint. The following example illustrates the controls you use, and there are step-by-step instructions in the following section.
Fill Key Operating Points
You now fill the key operating points in the lookup table for spark angle.
The upper pane displays the lookup table, and the lower pane displays the behavior of the torque and NOX emissions models with each variable.
The object is to maximize the torque and restrict NOX emissions to below 250 g/hr.
At each operating point, the behavior of the model alters. The following display shows the behavior of the models over the range of the input variables at the operating point selected in the table, where speed (N) is 4500 and load (L) is 0.5. You can show confidence intervals by selecting View > Display Confidence Intervals.
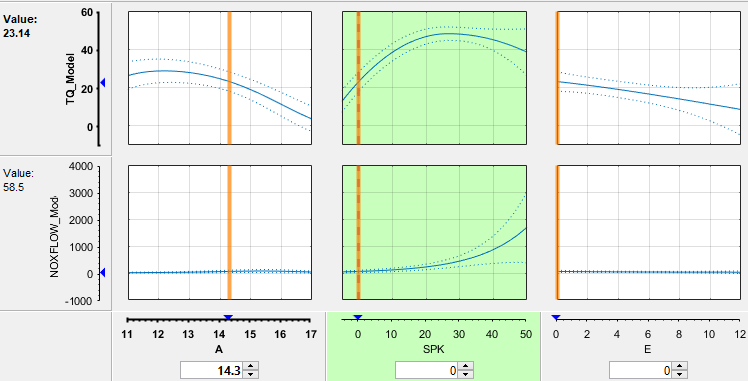
The top three graphs show how the torque model varies with the AFR (labeled
A), the spark angle (SPK), and the EGR
(E), respectively. The lower panes show how the NOX
emissions model varies with these variables.
You are calibrating the Spark table, so the two spark
(SPK) graphs are green, indicating that these graphs are
directly linked to the currently selected lookup table.
Select the operating point
N = 4500andL = 0.5in the lookup table.Now try to find the spark angle that gives the maximum torque and restricts NOX emissions to below 250 g/hr. You can change the value of spark by clicking and dragging the orange line on the
SPKgraphs, or by typing values into theSPKedit box. You can change the values of any of the other tradeoff variables in the same way, but as you have already set constant values for A and E you should not change these. Try different values of spark and look at the resulting values of the torque and NOX models.Click to select the top SPK - TQ_Model graph (
TQ_Modelrow,SPKcolumn). When selected the graph is outlined as shown in the following example.Now click 'Find maximum of output' (
 ) in the toolbar. This calculates the value of
spark that gives the maximum value of torque. The following display
shows the behavior of the two models when the spark angle is
) in the toolbar. This calculates the value of
spark that gives the maximum value of torque. The following display
shows the behavior of the two models when the spark angle is
26.4458, which gives maximum torque output.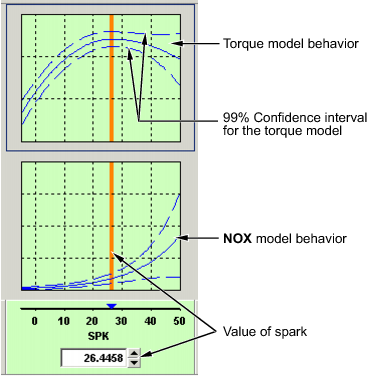
At this operating point, the maximum torque that is generated is
48.136when the spark angle is26.4989. However, the value of NOX is348.968, which is greater than the restriction of 250 g/hr. Clearly you have to look at another value of spark angle.Click and drag the orange bar to change to a lower value of spark. Notice the change in the resulting values of the torque and NOX models.
Enter
21.5as the value of SPK in the edit box at the bottom of the SPK column.The value of the NOX emissions model is now
249.154. This is within the restriction, and the value of torque is47.2478.At this operating point, this value of
21.5degrees is acceptable for the spark angle lookup table, so you want to apply this point to your table.Press Ctrl+T or click
 (Fill lookup tables with current tradeoff
values and save) in the toolbar to apply that value to the spark
table.
(Fill lookup tables with current tradeoff
values and save) in the toolbar to apply that value to the spark
table.This automatically adds the selected value of spark to the table and turns this cell yellow. It is blue when selected, yellow if you click elsewhere. Look at the table legend to see what this means: yellow cells have been added to the extrapolation mask, and the tick mark indicates that you saved this input value by applying it from the tradeoff. You can use the View menu to choose whether to display the legend.
Now repeat this process of finding acceptable values of spark at four more operating points listed in the table following. In each case,
Select the cell in the spark table at the specified values of speed and load.
Enter the value of spark given in the table (the spark angles listed all satisfy the requirements).
Press Ctrl+T or click
(Fill lookup tables with current
tradeoff values and save) in the toolbar to apply that value
to the spark table. Speed, N Load, L Spark Angle, SPK 2500
0.3
25.75
3000
0.8
10.7
5000
0.7
8.2
6000
0.2
41.3
Fill the Table by Extrapolation
When you have calibrated several key operating points, you can produce a smooth extrapolation of these values across the whole table.
When you apply the value of the spark angle to the lookup table, the selected cell is automatically added to the extrapolation mask. This is why the cell is colored yellow. The extrapolation mask is the set of cells that are used as the basis for filling the table by extrapolation.
Click ![]() in the toolbar to fill the table by extrapolation.
in the toolbar to fill the table by extrapolation.
The lookup table is filled with values of spark angle.
The following figure displays the view after extrapolation over the table.
Note
Not all the points in the lookup table will necessarily fulfill the requirements of maximizing torque and restricting the NOX emissions.
Export Calibrations
To export your table and its normalizers:
Select the
Sparknode in the branch display.Select File > Export > Calibration.
Choose the file type you want for your calibration. For the purposes of this tutorial, select
Comma Separated Value (.csv).Enter
tradeoff.csvas the file name and click Save.
This exports the spark angle table and the normalizers,
Speed, and Load.