Triangulations
Triangulations are often used to represent 2-D and 3-D geometric domains in application areas such as computer graphics, physical modeling, geographic information systems, medical imaging, and more. The map polygon shown here
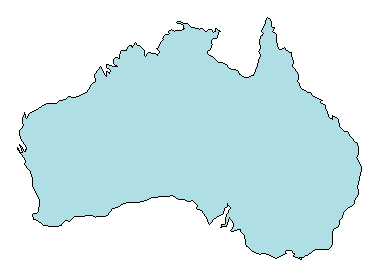
can be represented by the triangulation on the map shown below.
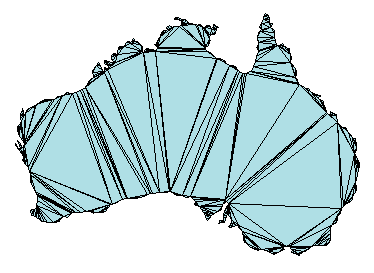
The triangulation decomposes a complex polygon into a collection of simpler triangular polygons. You can use these polygons for developing geometric-based algorithms or graphics applications.
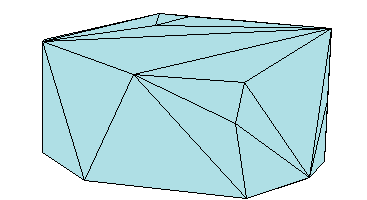
Similarly, you can represent the boundary of a 3-D geometric domain using a triangulation. The figure below shows the convex hull of a set of points in 3-D space. Each facet of the hull is a triangle.
You can represent and query the following types of triangulations using MATLAB®:
2-D triangulations consisting of triangles bounded by vertices and edges
3-D surface triangulations consisting of triangles bounded by vertices and edges
3-D triangulations consisting of tetrahedra bounded by vertices, edges, and faces
MATLAB uses a matrix format to represent triangulations. This format has two parts:
The vertices, represented as a matrix in which each row contains the coordinates of a point in the triangulation.
The triangulation connectivity, represented as a matrix in which each row defines a triangle or tetrahedron.
This figure shows a simple 2-D triangulation.
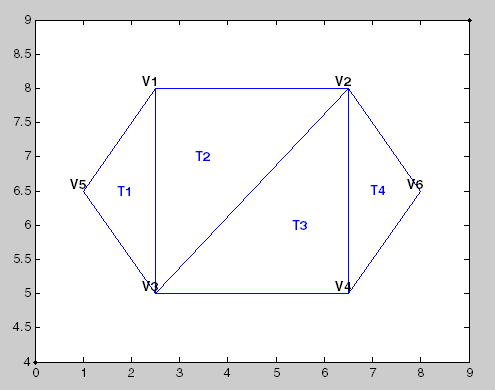
The following table shows the vertex information.
| Vertices | ||
|---|---|---|
| Vertex ID | x-coordinate | y-coordinate |
| V1 | 2.5 | 8.0 |
| V2 | 6.5 | 8.0 |
| V3 | 2.5 | 5.0 |
| V4 | 6.5 | 5.0 |
| V5 | 1.0 | 6.5 |
| V6 | 8.0 | 6.5 |
The data in the previous table is stored as a matrix in the MATLAB environment. The vertex IDs are labels used for identifying specific vertices. They are shown to illustrate the concept of a vertex ID, but they are not stored explicitly. Instead, the row numbers of the matrix serve as the vertex IDs.
The triangulation connectivity data is shown in this table.
| Connectivity | |||
|---|---|---|---|
| Triangle ID | IDs of Bounding Vertices | ||
| T1 | 5 | 3 | 1 |
| T2 | 3 | 2 | 1 |
| T3 | 3 | 4 | 2 |
| T4 | 4 | 6 | 2 |
The data in this table is stored as a matrix in the MATLAB environment. The triangle IDs are labels used for identifying specific triangles. They are shown to illustrate the concept of a triangle ID, but they are not stored explicitly. Instead, the row numbers of the matrix serve as the triangle IDs.
You can see that triangle T1 is defined by three vertices,
{V5, V3, V1}. Similarly, T4 is defined by the
vertices, {V4, V6, V2}. This format extends naturally to higher dimensions,
which require additional columns of data. For example, a tetrahedron in 3-D space is defined
by four vertices, each of which have three coordinates, (x,
y, z).
The matrix format provides a compact low-level, array-based representation for triangulations. When you use triangulations to develop algorithms, you might need more information about the geometric properties, topology, and adjacency information.
For example, you might compute the triangle incenters before plotting the annotated triangulation shown below. In this case, you use the incenters to display the triangle labels (T1, T2, etc.) within each triangle. If you want to plot the boundary in red, you need to determine the edges that are referenced by only one triangle.
