General Triangulation from Matrix Data
Create a triangulation object by using the triangulation matrix data.
Create a matrix, P, that contains the vertex data.
P = [2.5 8.0
     6.5 8.0
     2.5 5.0
     6.5 5.0
     1.0 6.5
     8.0 6.5];
Define the connectivity, T.
T = [5 3 1;
     3 2 1;
     3 4 2;
     4 6 2];
Create a triangulation object from this data.
TR = triangulation(T,P)
TR =
  triangulation with properties:

              Points: [6×2 double]
    ConnectivityList: [4×3 double]
Access the properties in a triangulation object in the same way you access the fields of a struct array. For example, examine the Points property, which contains the coordinates of the vertices.
TR.Points
ans = 6×2

    2.5000    8.0000
    6.5000    8.0000
    2.5000    5.0000
    6.5000    5.0000
    1.0000    6.5000
    8.0000    6.5000
Next, examine the connectivity.
TR.ConnectivityList
ans = 4×3

     5     3     1
     3     2     1
     3     4     2
     4     6     2
The Points and ConnectivityList properties define the matrix data for the triangulation.
The triangulation object is a wrapper around the matrix data. The real benefit is the usefulness of the triangulation object methods. The methods are like functions that accept a triangulation and other relevant input data.
The triangulation object provides an easy way to index into the ConnectivityList property matrix. Access the first triangle in the triangulation.
TR.ConnectivityList(1,:)
ans = 1×3

     5     3     1
Another way of getting the first triangle is TR(1,:).
Examine the first vertex of the first triangle.
TR(1,1)
ans =
5
Examine the second vertex of the first triangle.
TR(1,2)
ans =
3
Now, examine all the triangles in the triangulation.
TR(:,:)
ans = 4×3

     5     3     1
     3     2     1
     3     4     2
     4     6     2
Use triplot to plot the triangulation. The triplot function is not a triangulation method, but it accepts and can plot a triangulation.
triplot(TR)
axis equal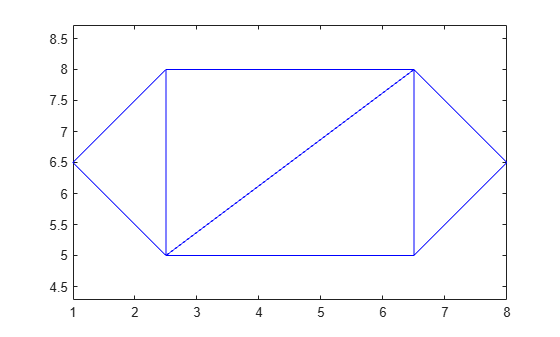
Use the triangulation method, freeBoundary, to query the free boundary and highlight it in a plot. This method returns the edges of the triangulation that are shared by only one triangle. The returned edges are expressed in terms of the vertex IDs.
boundaryedges = freeBoundary(TR)';
Now plot the boundary edges as a red line.
hold on
plot(P(boundaryedges,1),P(boundaryedges,2),"-r",LineWidth=2)
hold off
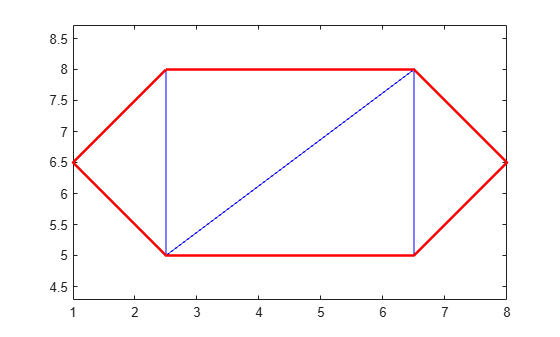
You can use the freeBoundary method to validate a triangulation. For example, if you observed red edges in the interior of the triangulation, then it would indicate a problem in how the triangles are connected.