Grouped Statistics Calculations with Tall Arrays
This example shows how to calculate grouped statistics of a tall timetable containing power outage data. The example uses the grouptransform, groupsummary, and groupcounts functions to calculate various quantities of interest, such as the most common power outage cause in each region. Even though the raw data in this example only has about 1500 rows, you can use the techniques presented here on much larger data sets because no assumptions are made about the size of the data.
Create Datastore and Tall Timetable
The sample file, outages.csv, contains data representing electric utility outages in the United States. The file contains six columns: Region, OutageTime, Loss, Customers, RestorationTime, and Cause.
Create a datastore for the outages.csv file. Use the "TextScanFormats" option to specify the kind of data each column contains: categorical ("%C"), floating-point numeric ("%f"), or datetime ("%D").
data_formats = ["%C","%D","%f","%f","%D","%C"];
ds = tabularTextDatastore("outages.csv","TextscanFormats",data_formats);
Create a tall table on top of the datastore, and convert the tall table into a tall timetable. The OutageTime variable is used for the row times since it is the first datetime or duration variable in the table.
T = tall(ds);
T = table2timetable(T)
T =

  M×5 tall timetable

    OutageTime    Region    Loss    Customers    RestorationTime    Cause
    __________    ______    ____    _________    _______________    _____

        ?           ?        ?          ?               ?             ?
        ?           ?        ?          ?               ?             ?
        ?           ?        ?          ?               ?             ?
        :           :        :          :               :             :
        :           :        :          :               :             :

Preview deferred. Learn more.
Replace Missing Data
Some of the rows in the RestorationTime variable have missing times, represented by NaT values. Remove these rows from the table.
T = rmmissing(T,"DataVariables","RestorationTime");
For the numeric variables in the timetable, instead of removing rows with missing values, replace the missing values with the mean value for each region.
T = grouptransform(T,"Region","meanfill",["Loss","Customers"]);
Use ismissing to confirm that no pieces of missing data remain in the table.
tf = any(ismissing(T),"all");
gather(tf)
Evaluating tall expression using the Local MATLAB Session: - Pass 1 of 4: Completed in 0.24 sec - Pass 2 of 4: Completed in 0.5 sec - Pass 3 of 4: Completed in 0.3 sec - Pass 4 of 4: Completed in 0.36 sec Evaluation completed in 2.3 sec
ans = logical
   0
Preview Data
Now that the data does not contain missing values, bring a small number of rows into memory to get an idea of what the data contains.
gather(head(T))
Evaluating tall expression using the Local MATLAB Session:
- Pass 1 of 1: Completed in 0.24 sec
Evaluation completed in 0.34 sec
ans=8×5 timetable
       OutageTime        Region       Loss     Customers     RestorationTime          Cause
    ________________    _________    ______    __________    ________________    _______________

    2002-02-01 12:18    SouthWest    458.98    1.8202e+06    2002-02-07 16:50    winter storm
    2003-02-07 21:15    SouthEast     289.4    1.4294e+05    2003-02-17 08:14    winter storm
    2004-04-06 05:44    West         434.81    3.4037e+05    2004-04-06 06:10    equipment fault
    2002-03-16 06:18    MidWest      186.44    2.1275e+05    2002-03-18 23:23    severe storm
    2003-06-18 02:49    West              0             0    2003-06-18 10:54    attack
    2004-06-20 14:39    West         231.29    1.5354e+05    2004-06-20 19:16    equipment fault
    2002-06-06 19:28    West         311.86    1.5354e+05    2002-06-07 00:51    equipment fault
    2003-07-16 16:23    NorthEast    239.93         49434    2003-07-17 01:12    fire
Mean Power Outage Duration by Region
Determine the mean power outage duration in each region using groupsummary. First, create a new variable OutageDuration in the table that contains the duration of each outage, found by subtracting the outage time from the restoration time. In the call to groupsummary, specify:
"Region"as the grouping variable"mean"as the computation method"OutageDuration"as the variable to operate on.
T.OutageDuration = T.RestorationTime - T.OutageTime;
times = groupsummary(T,"Region","mean","OutageDuration")
times =

  M×3 tall table

    Region    GroupCount    mean_OutageDuration
    ______    __________    ___________________

      ?           ?                  ?
      ?           ?                  ?
      ?           ?                  ?
      :           :                  :
      :           :                  :

Preview deferred. Learn more.
Change the display format of the duration results to be in days, and gather the results into memory. The results show the mean outage duration in each region, as well as the number of reported outages in each region.
times.mean_OutageDuration.Format = "d";
times = gather(times)
Evaluating tall expression using the Local MATLAB Session: - Pass 1 of 2: Completed in 0.43 sec - Pass 2 of 2: Completed in 0.57 sec Evaluation completed in 1.4 sec
times=5×3 table
     Region      GroupCount    mean_OutageDuration
    _________    __________    ___________________

    MidWest         138            34.135 days
    NorthEast       548             24.21 days
    SouthEast       379            1.7013 days
    SouthWest        25            2.4799 days
    West            349            28.061 days
Most Common Power Outage Causes by Region
Determine how often each power outage cause occurs in each region. Use groupcounts with the Cause and Region variables as grouping variables. Gather the results into memory.
causes = groupcounts(T,["Cause","Region"]);
causes = gather(causes)
Evaluating tall expression using the Local MATLAB Session:
- Pass 1 of 2: Completed in 0.27 sec
- Pass 2 of 2: Completed in 0.22 sec
Evaluation completed in 0.77 sec
causes=43×4 table
         Cause           Region      GroupCount    Percent
    ________________    _________    __________    ________

    attack              MidWest          12         0.83391
    attack              NorthEast       135          9.3815
    attack              SouthEast        19          1.3204
    attack              West            126          8.7561
    earthquake          NorthEast         1        0.069493
    earthquake          West              1        0.069493
    energy emergency    MidWest          19          1.3204
    energy emergency    NorthEast        29          2.0153
    energy emergency    SouthEast        79          5.4899
    energy emergency    SouthWest         7         0.48645
    energy emergency    West             46          3.1967
    equipment fault     MidWest           9         0.62543
    equipment fault     NorthEast        17          1.1814
    equipment fault     SouthEast        40          2.7797
    equipment fault     SouthWest         2         0.13899
    equipment fault     West             85          5.9069
      ⋮
Each cause occurs several times in the table, so even though the table contains the correct data it is not in the proper format to see how often each cause occurs in each region. To improve the presentation of the data, unstack the GroupCount variable so that each column corresponds to a region and each row corresponds to an outage cause.
RegionCauses = gather(unstack(causes,"GroupCount","Region","GroupingVariables","Cause"))
RegionCauses=10×6 table
         Cause          MidWest    NorthEast    SouthEast    SouthWest    West
    ________________    _______    _________    _________    _________    ____

    attack                 12         135           19          NaN       126
    earthquake            NaN           1          NaN          NaN         1
    energy emergency       19          29           79            7        46
    equipment fault         9          17           40            2        85
    fire                  NaN           5            3          NaN        17
    severe storm           30         139          132            6        22
    thunder storm          31         102           54            6         7
    unknown                 4          10            3          NaN         4
    wind                   16          40           13            3        22
    winter storm           17          70           36            1        19
Not all combinations of outage causes and regions are represented in the data, so the resulting table contains some NaNs. Fill in the NaN values with zeros.
RegionCauses = fillmissing(RegionCauses,"constant",{"",0,0,0,0,0})
RegionCauses=10×6 table
         Cause          MidWest    NorthEast    SouthEast    SouthWest    West
    ________________    _______    _________    _________    _________    ____

    attack                12          135           19           0        126
    earthquake             0            1            0           0          1
    energy emergency      19           29           79           7         46
    equipment fault        9           17           40           2         85
    fire                   0            5            3           0         17
    severe storm          30          139          132           6         22
    thunder storm         31          102           54           6          7
    unknown                4           10            3           0          4
    wind                  16           40           13           3         22
    winter storm          17           70           36           1         19
Worst Power Outages in Each Region
Calculate the broadest customer impact for each power outage in each region.
WorstOutages = groupsummary(T,["Region","Cause"],"max","Customers");
WorstOutages = gather(WorstOutages)
Evaluating tall expression using the Local MATLAB Session:
- Pass 1 of 2: Completed in 0.16 sec
- Pass 2 of 2: Completed in 0.2 sec
Evaluation completed in 0.5 sec
WorstOutages=43×4 table
     Region           Cause          GroupCount    max_Customers
    _________    ________________    __________    _____________

    MidWest      attack                  12         2.4403e+05
    MidWest      energy emergency        19         5.0376e+05
    MidWest      equipment fault          9         2.4403e+05
    MidWest      severe storm            30          3.972e+06
    MidWest      thunder storm           31         3.8233e+05
    MidWest      unknown                  4         3.0879e+06
    MidWest      wind                    16         2.8666e+05
    MidWest      winter storm            17         7.7697e+05
    NorthEast    attack                 135         1.5005e+05
    NorthEast    earthquake               1                  0
    NorthEast    energy emergency        29         1.5005e+05
    NorthEast    equipment fault         17          1.667e+05
    NorthEast    fire                     5         4.5139e+05
    NorthEast    severe storm           139         1.0735e+06
    NorthEast    thunder storm          102         5.9689e+06
    NorthEast    unknown                 10         2.4983e+06
      ⋮
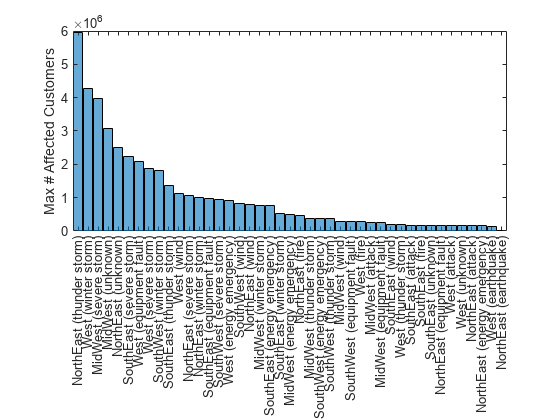
Combine the data in the Region and Cause variables into a single categorical variable by briefly converting them into strings. Then, create a categorical histogram of the maximum number of affected customers for each cause in each region.
WorstOutages.RegionCause = categorical(string(WorstOutages.Region)+" ("+string(WorstOutages.Cause)+")");
histogram("Categories",WorstOutages.RegionCause,"BinCounts",WorstOutages.max_Customers,...
    "DisplayOrder","descend")
ylabel("Max # Affected Customers")
See Also
findgroups | splitapply | tall