Create Common 2-D Plots
This example shows how to create a variety of 2-D plots in MATLAB®.
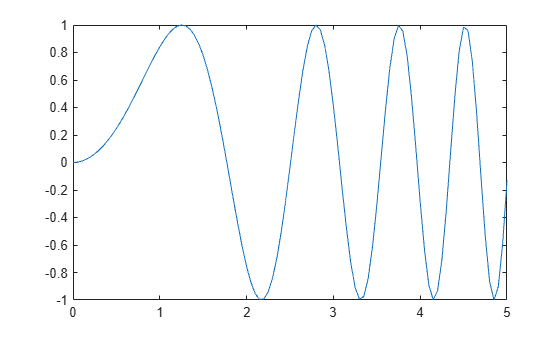
Line Plots
The plot function creates simple line plots of x and y values.
x = 0:0.05:5;
y = sin(x.^2);
figure
plot(x,y)
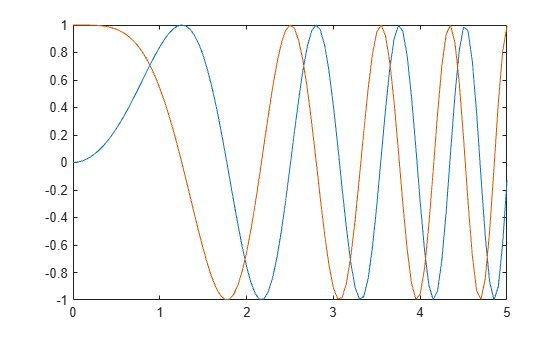
Line plots can display multiple sets of x and y data.
y1 = sin(x.^2);
y2 = cos(x.^2);
plot(x,y1,x,y2)
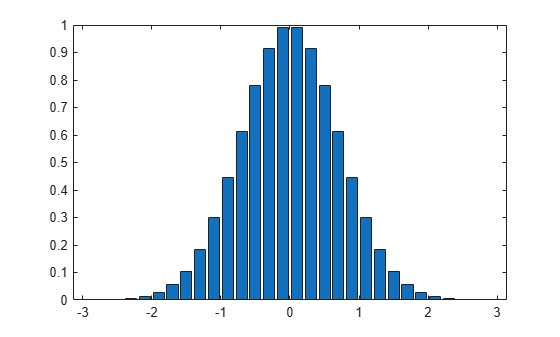
Bar Plots
The bar function creates vertical bar charts. The barh function creates horizontal bar charts.
x = -2.9:0.2:2.9;
y = exp(-x.*x);
bar(x,y)
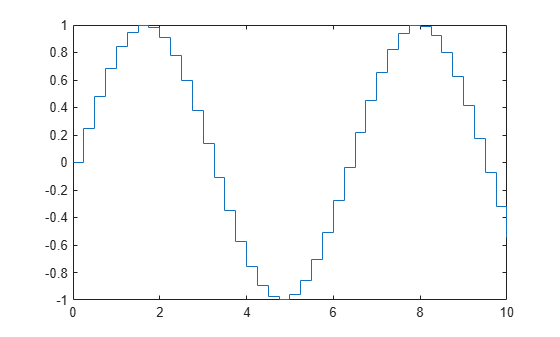
Stairstep Plots
The stairs function creates a stairstep plot. It can create a stairstep plot of Y values only or a stairstep plot of x and y values.
x = 0:0.25:10;
y = sin(x);
stairs(x,y)
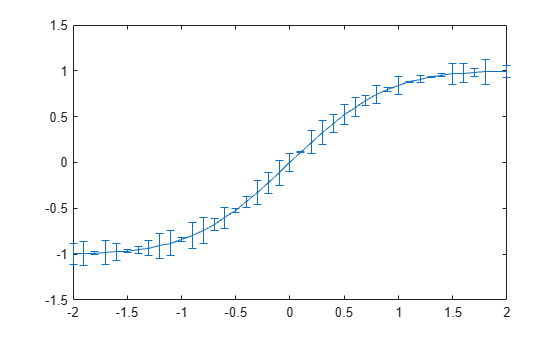
Errorbar Plots
The errorbar function draws a line plot of x and y values and superimposes a vertical error bar on each observation. To specify the size of the error bar, pass an additional input argument to the errorbar function.
x = -2:0.1:2;
y = erf(x);
eb = rand(size(x))/7;
errorbar(x,y,eb)
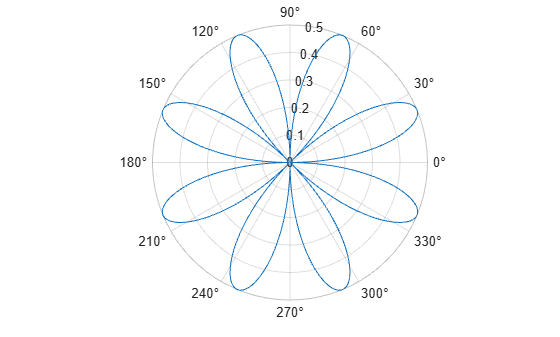
Polar Plots
The polarplot function draws a polar plot of the angle values in theta (in radians) versus the radius values in rho.
theta = 0:0.01:2*pi;
rho = abs(sin(2*theta).*cos(2*theta));
polarplot(theta,rho)
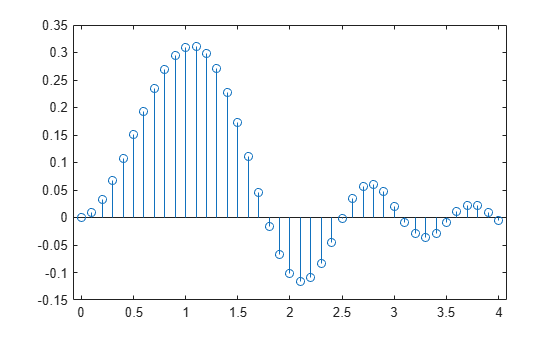
Stem Plots
The stem function draws a marker for each x and y value with a vertical line connected to a common baseline.
x = 0:0.1:4;
y = sin(x.^2).*exp(-x);
stem(x,y)
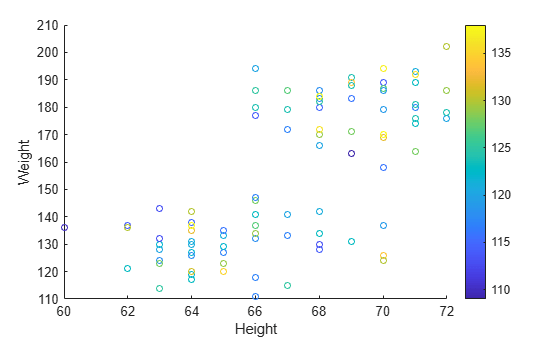
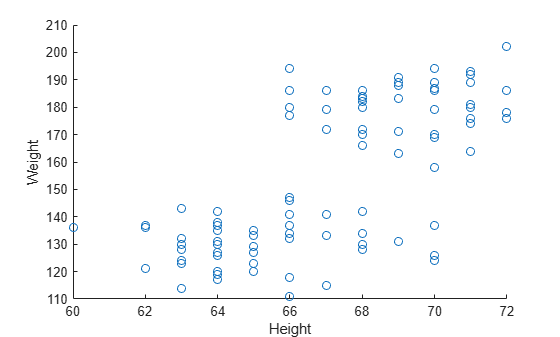
Scatter Plots
The scatter function draws a scatter plot of x and y values.
load patients Height Weight Systolic
scatter(Height,Weight)
xlabel('Height')
ylabel('Weight')
Use optional arguments to the scatter function to specify the marker size and color. Use the colorbar function to show the color scale on the current axes.
scatter(Height,Weight,20,Systolic)
xlabel('Height')
ylabel('Weight')
colorbar