Chart Class with Custom Property Display
This example shows how to define a class of charts with a custom property display that lists only a subset of the properties. The following code demonstrates how to overload the getPropertyGroups method of the matlab.mixin.CustomDisplay class. The example also demonstrates the basic coding pattern for charts that derive from the matlab.graphics.chartcontainer.ChartContainer base class. You can use this example to become familiar with the coding techniques of chart development, or as the basis for a class you plan to develop.
To define the class, copy the following code into the editor and save it with the name SmoothPlotCustomDisplay.m in a writable folder.
classdef SmoothPlotCustomDisplay < matlab.graphics.chartcontainer.ChartContainer
    % c = SmoothPlotCustomDisplay('XData',X,'YData',Y,Name,Value,...)
    % plots a dotted line of the coordinates in X and Y with a smoothed
    % version of the line. You can also specify additonal name-value
    % arguments, such as 'SmoothColor' and 'SmoothWidth'.
    properties
        XData (1,:) double = NaN
        YData (1,:) double = NaN
        SmoothColor {validatecolor} = [0.9290 0.6940 0.1250]
        SmoothWidth (1,1) double = 2
    end
    properties(Access = private,Transient,NonCopyable)
        OriginalLine (1,1) matlab.graphics.chart.primitive.Line
        SmoothLine (1,1) matlab.graphics.chart.primitive.Line
    end

    methods(Access = protected)
        function setup(obj)
            % Get the axes
            ax = getAxes(obj);

            % Create the original and smooth lines
            obj.OriginalLine = plot(ax,NaN,NaN,'LineStyle',':');
            hold(ax,'on')
            obj.SmoothLine = plot(ax,NaN,NaN,'LineStyle','-',...
                'Color',[0.9290 0.6940 0.1250],'LineWidth',2);
            hold(ax,'off')
        end
        function update(obj)
            % Update line data
            obj.OriginalLine.XData = obj.XData;
            obj.OriginalLine.YData = obj.YData;
            obj.SmoothLine.XData = obj.XData;
            obj.SmoothLine.YData = createSmoothData(obj);

            % Update line color and width
            obj.SmoothLine.Color = obj.SmoothColor;
            obj.SmoothLine.LineWidth = obj.SmoothWidth;
        end
        function propgrp = getPropertyGroups(obj)
            if ~isscalar(obj)
                % List for array of objects
                propgrp = getPropertyGroups@matlab.mixin.CustomDisplay(obj);

            else
                % List for scalar object
                propList = {'SmoothColor','XData','YData'};
                propgrp = matlab.mixin.util.PropertyGroup(propList);
            end
        end
        function sm = createSmoothData(obj)
            % Calculate smoothed data
            v = ones(1,10)*0.1;
            sm = conv(obj.YData,v,'same');
        end
    end
end
After saving the class file, you can create an instance of the chart. Omit the semicolon when you create the chart to see the customized display.
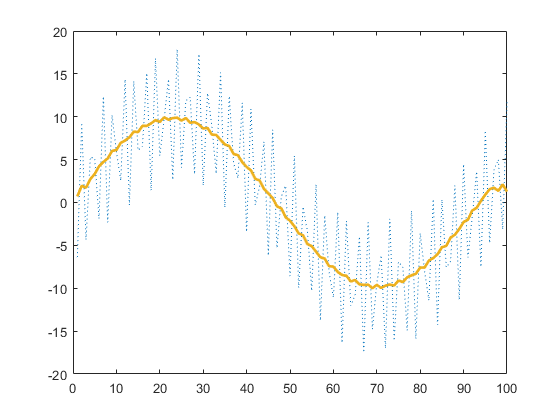
x = 1:1:100;
y = 10*sin(x/15)+8*sin(10*x+0.5);
c = SmoothPlotCustomDisplay('XData',x,'YData',y)
c =

  SmoothPlotCustomDisplay with properties:

    SmoothColor: [0.9290 0.6940 0.1250]
          XData: [1 2 3 4 5 6 7 8 9 10 11 12 13 14 15 16 17 … ] (1×100 double)
          YData: [-6.3714 9.3040 -4.3583 5.3084 5.1309 … ] (1×100 double)

  Use GET to show all properties