outlinegeoquad
Polygon outlining geographic quadrangle
Syntax
[lat,lon] = outlinegeoquad(latlim,lonlim,dlat,dlon)
Description
[lat,lon] = outlinegeoquad(latlim,lonlim,dlat,dlon) constructs
a polygon that traces the outline of the geographic quadrangle
defined by latlim and lonlim.
Such a polygon can be useful for displaying the quadrangle graphically,
especially on a projection where the meridians and/or parallels do
not project to straight lines. latlim is a two-element
vector of the form: [southern-limit northern-limit] and lonlim is
a two-element vector of the form: [western-limit eastern-limit]. dlat is
a positive scalar that specifies a minimum vertex spacing in degrees
to be applied along the meridians that bound the eastern and western
edges of the quadrangle. Likewise, dlon is a positive
scalar that specifies a minimum vertex spacing in degrees of longitude
to be applied along the parallels that bound the northern and southern
edges of the quadrangle. The outputs lat and lon contain
the vertices of a simple closed polygon with clockwise vertex ordering.
Examples
Display the outlines of three geographic quadrangles having very different qualities on top of a simple base map:
figure('Color','white')
axesm('ortho','Origin',[-45 110],'frame','on','grid','on')
axis off
load coastlines
geoshow(coastlat, coastlon)

% Quadrangle covering Australia and vicinity
[lat, lon] = outlinegeoquad([-45 5],[110 175],5,5);
geoshow(lat,lon,'DisplayType','polygon','FaceAlpha',0.5);

% Quadrangle covering Antarctic region
antarcticCircleLat = dms2degrees([-66 33 39]);
[lat, lon] = outlinegeoquad([-90 antarcticCircleLat], ...
   [-180 180],5,5);
geoshow(lat,lon,'DisplayType','polygon', ...
       'FaceColor','cyan','FaceAlpha',0.5);

% Quadrangle covering nominal time zone 9 hours ahead of UTC
[lat, lon] = outlinegeoquad([-90 90], 135 + [-7.5 7.5], 5, 5);
geoshow(lat,lon,'DisplayType','polygon', ...
       'FaceColor','green','FaceAlpha',0.5);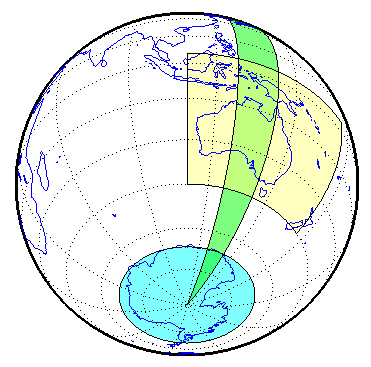
Tips
All input and output angles are in units of degrees. Choose
a reasonably small value for dlat (a few degrees,
perhaps) when using a projection with curved meridians or curved
parallels.
To avoid interpolating extra vertices along meridians or parallels,
set dlat or dlon to a value
of Inf.
Special Cases
The insertion of additional vertices is suppressed at the poles
(that is, if latlim(1) == -90 or latlim(2)
== 90. If lonlim corresponds to a quadrangle
width of exactly 360 degrees (lonlim == [-180 180],
for example), then it covers a full latitudinal zone and includes
two separate, NaN-separated parts, unless either
latlim(1) == -90orlatlim(2) == 90, so that only one part is needed—a polygon that follows a parallel clockwise around one of the poles.latlim(1) == -90andlatlim(2) == 90, so that the quadrangle encompasses the entire planet. In this case, the quadrangle cannot be represented by a latitude-longitude polygon, and an error results.
Version History
Introduced in R2008a