Segment Thermographic Image After Edge-Preserving Filtering
This example shows how to work with thermal images, demonstrating a simple segmentation. Thermal images are obtained from thermographic cameras, which detect radiation in the infrared range of the electromagnetic spectrum. Thermographic images capture infrared radiation emitted by all objects above absolute zero.
Read a thermal image into the workspace and use whos to understand more about the image data.
I = imread("hotcoffee.tif");

whos I
  Name        Size              Bytes  Class     Attributes

  I         240x320            307200  single
Compute the dynamic range occupied by the data to see the range of temperatures occupied by the image. The pixel values in this image correspond to actual temperatures on the Celsius scale.
range = [min(I(:)) max(I(:))]
range = 1×2 single row vector

   22.4729   77.3727
Display the thermal image. Because the thermal image is a single-precision image with a dynamic range outside 0 to 1, you must use the imshow auto-scaling capability to display the image.
figure
imshow(I,[])
colormap(gca,hot)
title("Original image")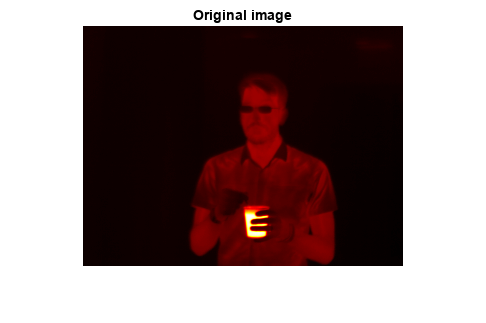
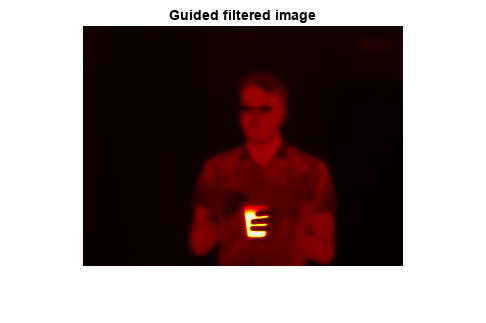
Apply edge-preserving smoothing to the image to remove noise while still retaining image details. This is a preprocessing step before segmentation. Use the imguidedfilter function to perform smoothing under self-guidance. The DegreeOfSmoothing name-value argument controls the amount of smoothing and is dependent on the range of the image. Adjust the DegreeOfSmoothing to accommodate the range of the thermographic image. Display the filtered image.
smoothValue = 0.01*diff(range).^2;
J = imguidedfilter(I,"DegreeOfSmoothing",smoothValue);

figure
imshow(J,[])
colormap(gca,hot)
title("Guided filtered image")
Determine threshold values to use in segmentation. The image has 3 distinct regions - the person, the hot object and the background - that appear well separated in intensity (temperature). Use multithresh to compute a 2-level threshold for the image. This partitions the image into 3 regions using Otsu's method.
thresh = multithresh(J,2)
thresh = 1×2 single row vector

   27.0018   47.8220
Threshold the image using the values returned by multithresh. The threshold values are at 27 and 48 Celsius. The first threshold separates the background intensity from the person and the second threshold separates the person from the hot object. Segment the image and fill holes.
L = imquantize(J,thresh);
L = imfill(L);

figure
imshow(label2rgb(L))
title("Label matrix from 3-level Otsu")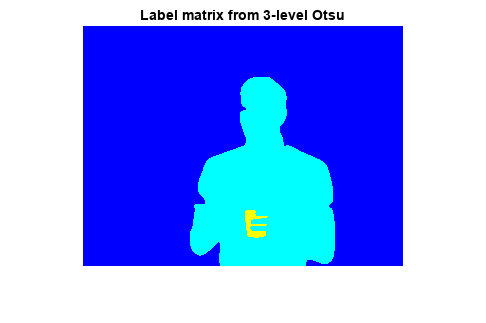
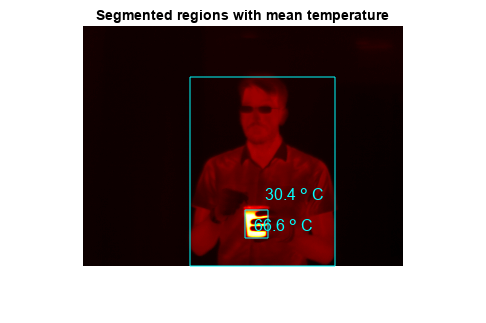
Draw a bounding box around the foreground regions in the image and put the mean temperature value of the region in the box. The example assumes that the largest region is the background. Use the regionprops function to get information about the regions in the segmented image.
props = regionprops(L,I,["Area","BoundingBox","MeanIntensity","Centroid"]);

% Find the index of the background region.
[~,idx] = max([props.Area]);

figure
imshow(I,[])
colormap(gca,hot)
title("Segmented regions with mean temperature")
for n = 1:numel(props)
    % If the region is not background
    if n ~= idx
        % Draw bounding box around region
       rectangle("Position",props(n).BoundingBox,"EdgeColor","c")

       % Draw text displaying mean temperature in Celsius
       T = num2str(props(n).MeanIntensity,3)+" \circ C";
       text(props(n).Centroid(1),props(n).Centroid(2),T,...
           "Color","c","FontSize",12)
    end
end
See Also
imquantize | imguidedfilter | multithresh | imfill