Gamma Correction
When you map intensity values from one range to another, you can optionally perform a nonlinear mapping using gamma correction. The gamma correction factor can be any value between 0 and infinity.
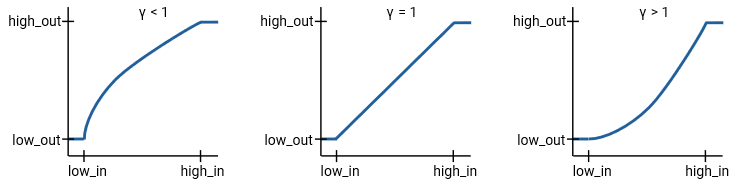
When gamma is less than 1, the mapping is weighted toward higher (brighter) output values.
When gamma is greater than 1, the mapping is weighted toward lower (darker) output values.
When gamma is exactly 1, the mapping is linear.
The figure illustrates this relationship. The three transformation curves show how values are mapped when gamma is less than, equal to, and greater than 1. In each graph, the x-axis represents the intensity values in the input image, and the y-axis represents the intensity values in the output image.
Plots Showing Three Different Gamma Correction Settings
Specify Gamma When Adjusting Contrast
This example shows how to specify gamma when adjusting contrast with the imadjust function. By default, imadjust uses a gamma value of 1, which means that it uses a linear mapping between intensity values in the original image and the output image. A gamma value less than 1 weights the mapping toward higher (brighter) output values. A gamma value of more than 1 weights output values toward lower (darker) output values.
Read an image into the workspace. This example reads an indexed image and then converts it into a grayscale image.
[X,map] = imread("forest.tif");
I = ind2gray(X,map);
Adjust the contrast, specifying a gamma value of less than 1 (0.5). Notice that in the call to imadjust, the example specifies the data ranges of the input and output images as empty matrices. When you specify an empty matrix, imadjust uses the default range of [0,1]. In the example, both ranges are left empty. This means that gamma correction is applied without any other adjustment of the data.
J = imadjust(I,[],[],0.5);
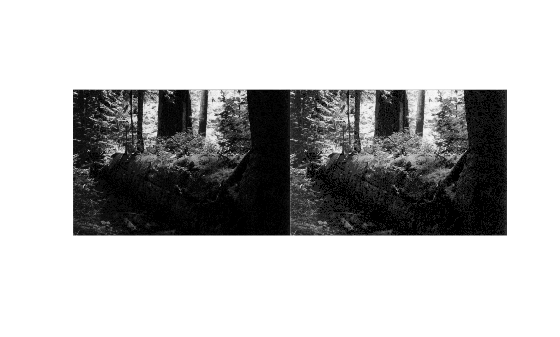
Display the original image with the contrast-adjusted image.
imshowpair(I,J,"montage")