Derive Statistics from GLCM and Plot Correlation
This example shows how to create a set of Gray-Level Co-Occurrence Matrices (GLCMs) and derive statistics from them. The example also illustrates how the statistics returned by graycoprops have a direct relationship to the original input image.
Read an image into the workspace and display it. The example converts the truecolor image to a grayscale image and then, for this example, rotates it 90 degrees.
circuitBoard = rot90(im2gray(imread("board.tif")));
imshow(circuitBoard)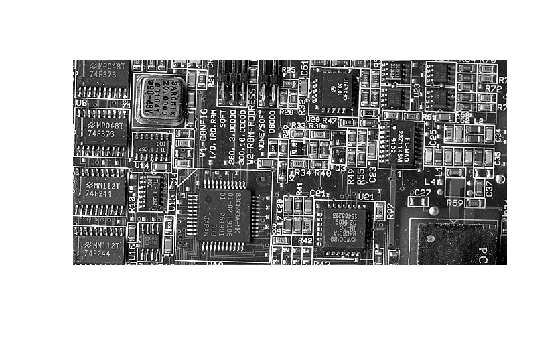
Define offsets of varying direction and distance. Because the image contains objects of a variety of shapes and sizes that are arranged in horizontal and vertical directions, the example specifies a set of horizontal offsets that only vary in distance.
offsets0 = [zeros(40,1) (1:40)'];
Create the GLCMs. Call the graycomatrix function specifying the offsets.
glcms = graycomatrix(circuitBoard,"Offset",offsets0);Derive statistics from the GLCMs using the graycoprops function. The example calculates the contrast and correlation.
stats = graycoprops(glcms,["Contrast" "Correlation"]);
Plot correlation as a function of offset.
figure, plot([stats.Correlation]);
title("Texture Correlation as a function of offset");
xlabel("Horizontal Offset")
ylabel("Correlation")

The plot contains peaks at offsets 7, 15, 23, and 30. If you examine the input image closely, you can see that certain vertical elements in the image have a periodic pattern that repeats every seven pixels.