Adjust Image Intensity Values to Specified Range
This example shows how to increase the contrast in a low-contrast grayscale image by remapping the data values to fill the entire available intensity range [0, 255].
Read image into the workspace.
I = imread('pout.tif');Adjust the contrast of the image using imadjust.
J = imadjust(I);
Display the original image and the adjusted image, side-by-side. Note the increased contrast in the adjusted image.
imshowpair(I,J,'montage')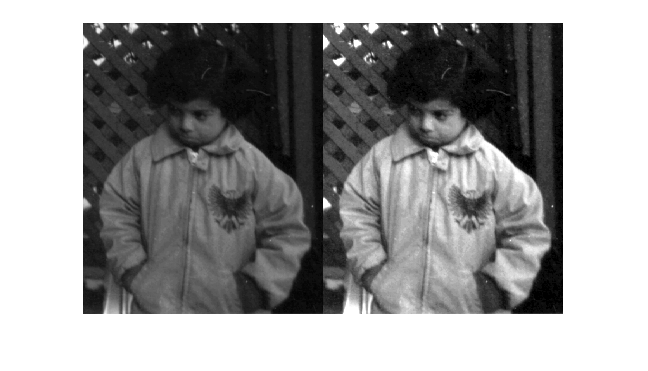
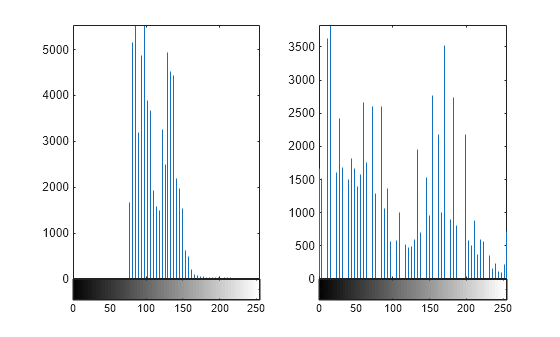
Plot the histogram of the adjust image. Note that the histogram of the adjusted image uses values across the whole range.
figure
subplot(1,2,1)
imhist(I,64)
subplot(1,2,2)
imhist(J,64)