Cluster Quasi-Random Data Using Fuzzy C-Means Clustering
This example shows how FCM clustering works using quasi-random two-dimensional data.
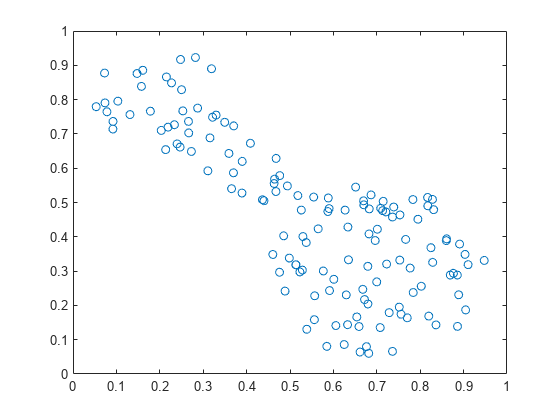
Load the data set and plot it.
load fcmdata.dat
plot(fcmdata(:,1),fcmdata(:,2),"o")
Using the fcm function, find two clusters in this data set. The clustering algorithm stops when the improvement in the objective function between subsequent iterations is below a threshold.
options = fcmOptions(NumClusters=2);
[center,U,objFcn] = fcm(fcmdata,options);
Iteration count = 1, obj. fcn = 8.97048
Iteration count = 2, obj. fcn = 7.1974
Iteration count = 3, obj. fcn = 6.32558
Iteration count = 4, obj. fcn = 4.58614
Iteration count = 5, obj. fcn = 3.89311
Iteration count = 6, obj. fcn = 3.8108
Iteration count = 7, obj. fcn = 3.7998
Iteration count = 8, obj. fcn = 3.79786
Iteration count = 9, obj. fcn = 3.79751
Iteration count = 10, obj. fcn = 3.79744
Iteration count = 11, obj. fcn = 3.79743
Iteration count = 12, obj. fcn = 3.79743
Minimum improvement reached.
center contains the coordinates of the two cluster centers, U contains the membership grades for each of the data points, and objFcn contains a history of the objective function across the iterations.
To view the progress of the clustering, plot the objective function.
figure
plot(objFcn)
title("Objective Function Values")
xlabel("Iteration Count")
ylabel("Objective Function Value")

Assign each data point to the cluster for which its cluster membership is greatest.
maxU = max(U);
index1 = find(U(1,:) == maxU);
index2 = find(U(2,:) == maxU);
Finally, plot the clustered data along with the two cluster centers found by the fcm function. The large characters in the plot indicate the cluster centers.
figure
plot(fcmdata(index1,1),fcmdata(index1,2),"og")
hold on
plot(fcmdata(index2,1),fcmdata(index2,2),"xr")
plot(center(1,1),center(1,2),"ok",...
    MarkerSize=15,LineWidth=3)
plot(center(2,1),center(2,2),"xk",...
    MarkerSize=15,LineWidth=3)

Every time you run this example, the fcm function initializes with different initial conditions. This behavior can swap the order in which the cluster centers are computed and plotted.