Propose Data Types Based on Derived Ranges Using the fiaccel
Function
This example shows how to propose fixed-point
data types based on static ranges using the fiaccel function. The advantage of
proposing data types based on derived ranges is that you do not have
to provide test files that exercise your algorithm over its full operating
range. Running such test files often takes a very long time so you
can save time by deriving ranges instead.
Note
Derived range analysis is not supported for non-scalar variables.
Prerequisites
To complete this example, you must install the following products:
MATLAB®
Fixed-Point Designer™
C compiler
See Supported Compilers.
You can use
mex -setupto change the default compiler. See Change Default Compiler.
Create a New Folder and Copy Relevant Files
In a local, writable folder, create a function
dti.m.The
dtifunction implements a Discrete Time Integrator in MATLAB.function [y, clip_status] = dti(u_in) %#codegen % Discrete Time Integrator in MATLAB % % Forward Euler method, also known as Forward % Rectangular, or left-hand approximation. % The resulting expression for the output of % the block at step 'n' is % y(n) = y(n-1) + K * u(n-1) % init_val = 1; gain_val = 1; limit_upper = 500; limit_lower = -500; % Variable to hold state between % consecutive calls to this block persistent u_state; if isempty(u_state) u_state = init_val+1; end % Compute Output if (u_state > limit_upper) y = limit_upper; clip_status = -2; elseif (u_state >= limit_upper) y = limit_upper; clip_status = -1; elseif (u_state < limit_lower) y = limit_lower; clip_status = 2; elseif (u_state <= limit_lower) y = limit_lower; clip_status = 1; else y = u_state; clip_status = 0; end % Update State tprod = gain_val * u_in; u_state = y + tprod;
Create a test file,
dti_test.m, to exercise thedtialgorithm.The test script runs the
dtifunction with a sine wave input. The script then plots the input and output signals.% dti_test % cleanup clear dti % input signal x_in = sin(2.*pi.*(0:0.001:2)).'; pause(10); len = length(x_in); y_out = zeros(1,len); is_clipped_out = zeros(1,len); for ii=1:len data = x_in(ii); % call to the dti function init_val = 0; gain_val = 1; upper_limit = 500; lower_limit = -500; % call to the design that does DTI [y_out(ii), is_clipped_out(ii)] = dti(data); end figure('Name', [mfilename, '_plot']); subplot(2,1,1) plot(1:len,x_in) xlabel('Time') ylabel('Amplitude') title('Input Signal (Sin)') subplot(2,1,2) plot(1:len,y_out) xlabel('Time') ylabel('Amplitude') title('Output Signal (DTI)') disp('Test complete.');
It is a best practice is to create a separate test script to do pre- and post-processing, such as:
Loading inputs.
Setting up input values.
Outputting test results.
| Type | Name | Description |
|---|---|---|
| Function code | dti.m | Entry-point MATLAB function |
| Test file | dti_test.m | MATLAB script that tests dti.m |
Set Up the Fixed-Point Configuration Object
Create a fixed-point configuration object and configure the test file name.
fixptcfg = coder.config('fixpt');
fixptcfg.TestBenchName = 'dti_test';
Specify Design Ranges
Specify design range information for the dti function
input parameter u_in.
fixptcfg.addDesignRangeSpecification('dti', 'u_in', -1.0, 1.0)
Enable Plotting Using the Simulation Data Inspector
Select to run the test file to verify the generated fixed-point MATLAB code. Log inputs and outputs for comparison plotting and select to use the Simulation Data Inspector to plot the results.
fixptcfg.TestNumerics = true;
fixptcfg.LogIOForComparisonPlotting = true;
fixptcfg.PlotWithSimulationDataInspector = true;
Derive Ranges and Generate Fixed-Point Code
Use the fiaccel function to convert the floating-point MATLAB function, dti,
to fixed-point MATLAB code. Set the default
word length for the fixed-point data types to 16.
fixptcfg.ComputeDerivedRanges = true;
fixptcfg.ComputeSimulationRanges = false;
fixptcfg.DefaultWordLength = 16;

% Derive ranges  and generate fixed-point code
fiaccel -float2fixed fixptcfg dti
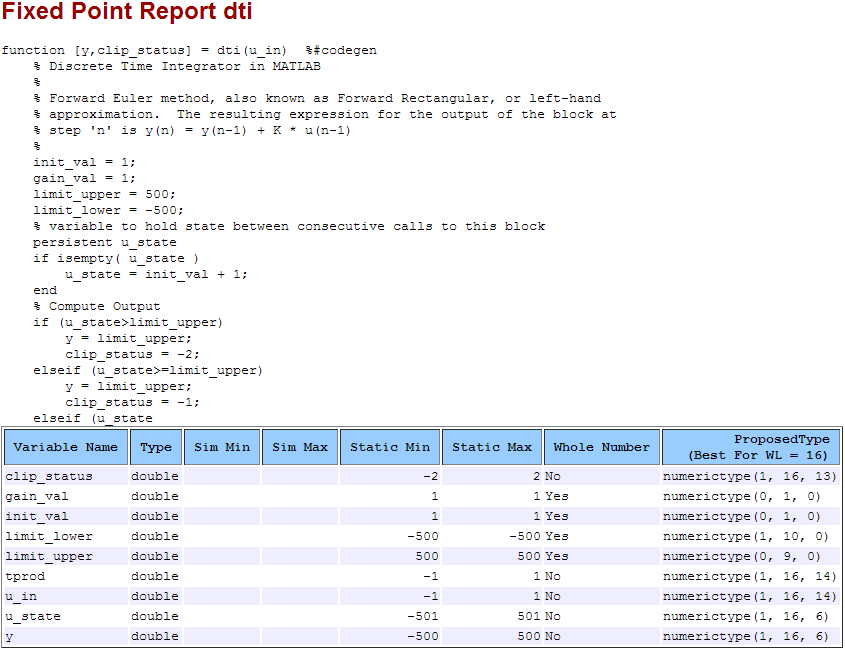
fiaccel analyzes the floating-point
code. Because you did not specify the input types for the dti function,
the conversion process infers types by simulating the test file. The
conversion process then derives ranges for variables in the algorithm.
It uses these derived ranges to propose fixed-point types for these
variables. When the conversion is complete, it generates a type proposal
report.
View Derived Range Information
Click the link to the type proposal report for the dti function, dti_report.html.
The report opens in a web browser.
View Generated Fixed-Point MATLAB Code
fiaccel generates a fixed-point version
of the dti function, dti_fxpt.m,
and a wrapper function that calls dti_fxpt. These
files are generated in the codegen\dti\fixpt folder
in your local working folder.
function [y, clip_status] = dti_fixpt(u_in) %#codegen
% Discrete Time Integrator in MATLAB
%
% Forward Euler method, also known as
% Forward Rectangular, or left-hand approximation.
% The resulting expression for the output of the
% block at step 'n' is y(n) = y(n-1) + K * u(n-1)
%
fm = get_fimath();

init_val = fi(1,0,1,0,fm);
gain_val = fi(1,0,1,0,fm);
limit_upper = fi(500,0,9,0,fm);
limit_lower = fi(-500,1,10,0,fm);

% variable to hold state between
% consecutive calls to this block
persistent u_state;
if isempty(u_state)
    u_state = fi(init_val+fi(1,0,1,0,fm),1,16,6,fm);
end

% Compute Output
if (u_state > limit_upper)
    y = fi(limit_upper, 1, 16, 6, fm);
    clip_status = fi(-2, 1, 16, 13, fm);
elseif (u_state >= limit_upper)
    y = fi(limit_upper, 1, 16, 6, fm);
    clip_status = fi(-1, 1, 16, 13, fm);
elseif (u_state < limit_lower)
	y = fi(limit_lower, 1, 16, 6, fm);
    clip_status = fi(2, 1, 16, 13, fm);
elseif (u_state <= limit_lower)
	y = fi(limit_lower, 1, 16, 6, fm);
    clip_status = fi(1, 1, 16, 13, fm);
else
    y = fi(u_state, 1, 16, 6, fm);
    clip_status = fi(0, 1, 16, 13, fm);
end

% Update State
tprod = fi(gain_val * u_in, 1, 16, 14, fm);
u_state(:) = y + tprod;
end


function fm = get_fimath()
	fm = fimath('RoundingMethod','Floor',...
        'OverflowAction','Wrap',...
        'ProductMode','FullPrecision',...
        'MaxProductWordLength',128,...
        'SumMode','FullPrecision',...
        'MaxSumWordLength',128);
end
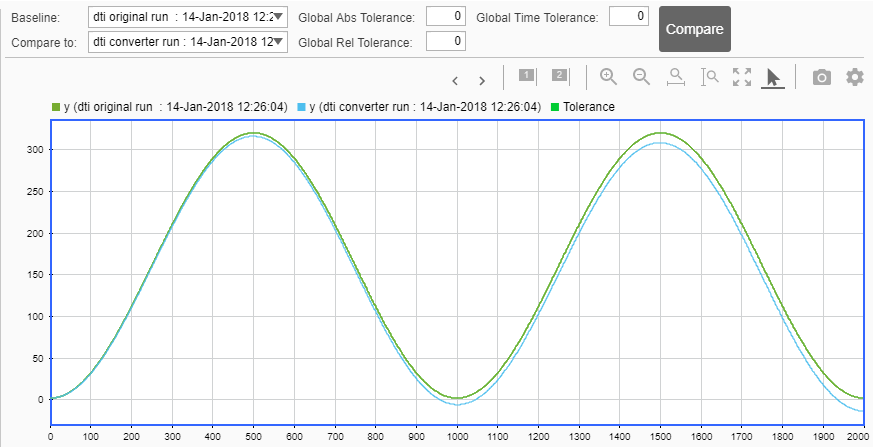
Compare Floating-Point and Fixed-Point Runs
Because you selected to log inputs and outputs for comparison plots and to use the Simulation Data Inspector for these plots, the Simulation Data Inspector opens.
You can use the Simulation Data Inspector to view floating-point
and fixed-point run information and compare results. For example,
to compare the floating-point and fixed-point values for the output y,
on the Compare tab, select y,
and then click Compare Runs.
The Simulation Data Inspector displays a plot of the baseline floating-point run against the fixed-point run and the difference between them.