Generate Static Code Metrics Report for Simulink Model
The Static Code Metrics Report is a section included in the HTML Code Generation Report. For more information on the static analysis of the generated code, see Static Code Metrics Analysis. To generate the static code metrics report in the HTML Code Generation Report:
Open the Configuration Parameters dialog box for your model. On the Code Generation > Report pane, select Generate static code metrics. If your model includes referenced models, select Generate static code metrics in the configuration for each referenced model. Otherwise, you cannot view a separate static code metrics report for a referenced model.
Alternatively, after you generate code, generate only the static code metrics report by using the function
coder.report.generateCodeMetrics.Press Ctrl+B to build your model and generate the HTML code generation report. For more information, see Generate Code Generation Report.
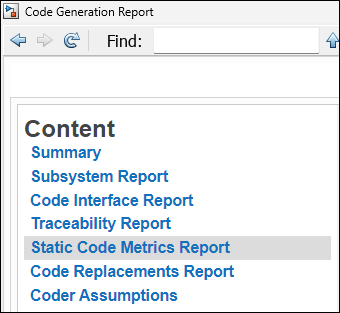
If the HTML Code Generation Report is not already open, open the report. On the left navigation pane, in the Content section, select Static Code Metrics Report.

If you generated only the static code metrics report, open the report. By default, the static code metrics report file
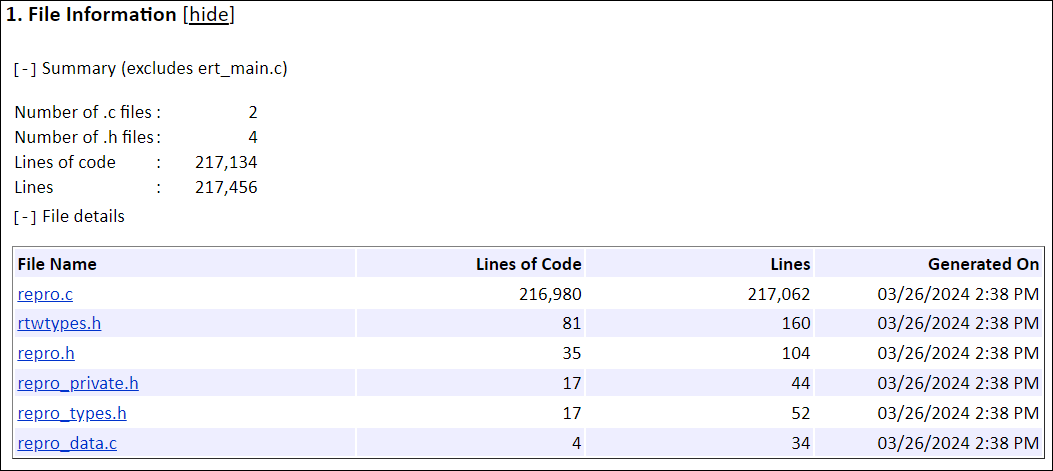
metrics.htmlis generated in the current folder.To see the generated files and how many lines of code are generated per file, look at the File Information section.

Point to the column headings and some cell values to see descriptions of the corresponding data.
If your model includes referenced models, the File information section includes a Referenced Model column. In this column, click the referenced model name to open its static code metrics report. If the static code metrics report is not available for a referenced model, select Generate static code metrics in the referenced model’s configuration set and rebuild your model.
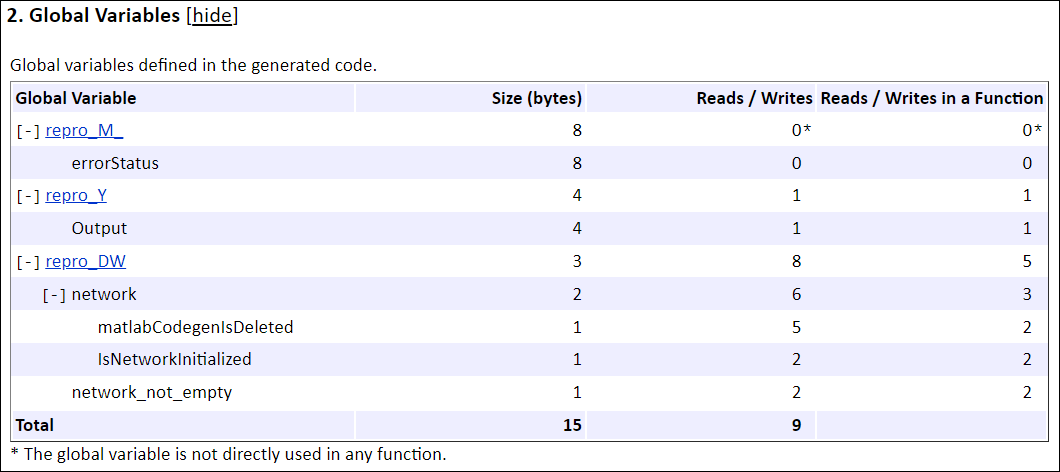
To view the global variables in the generated code, including their sizes and numbers of accesses, see the Global Variables section.

The Reads/Writes column displays the total number of read and write accesses to the global variable. The Reads/Writes in a Function column displays the maximum number of read and write accesses to the global variable within a function. You use this information to estimate the benefit of turning on optimizations, which reduce the number of global references. For more information, see Optimize Global Variable Usage.
Click
[+]to expand structures.
To navigate from the report to the source code, click a global variable or function name. These names are hyperlinks to their definitions.
To view local static variables and their total size, navigate to the Local Static Variables section.

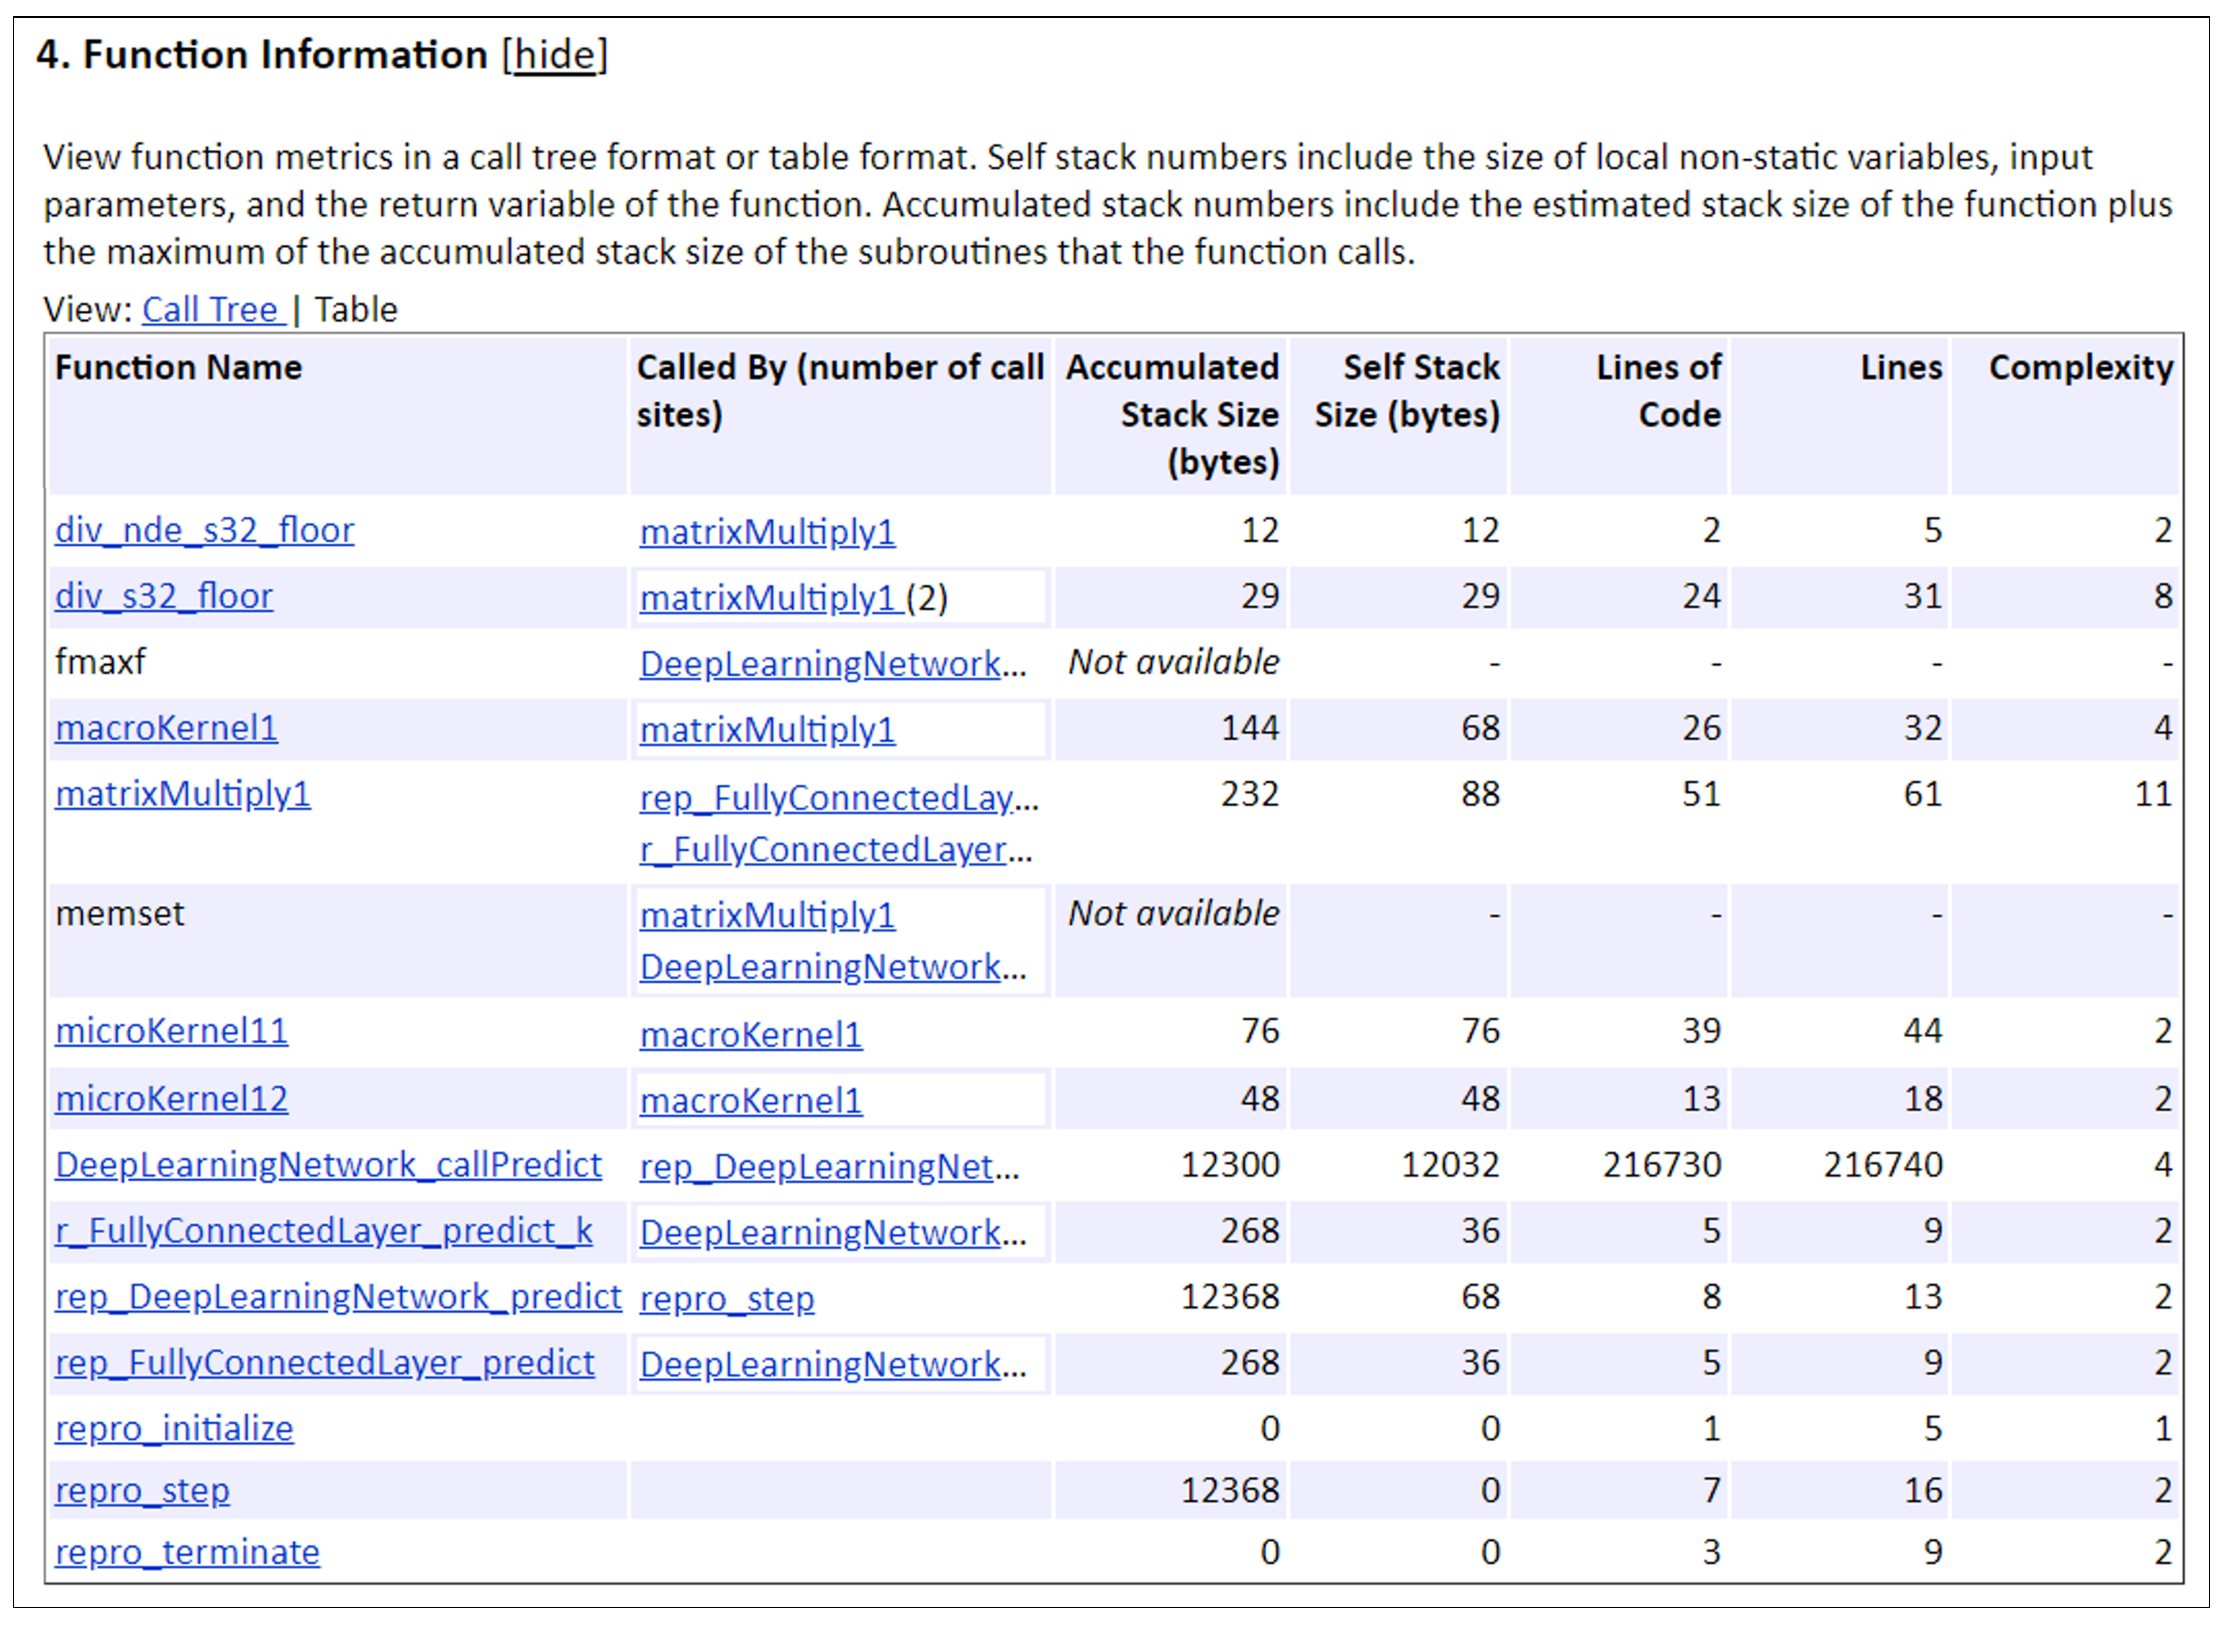
To view the function call tree of the generated code, in the Function Information section, click Call Tree at the top of the table.

ert_main.cis not included in the code metrics analysis, therefore it is not shown in the call tree format. The Complexity column includes the cyclomatic complexity of each function.To view the functions in a table format, click Table.

The second column, Called By, lists functions that call the function listed in the first column, using these criteria:
If a function is called by multiple functions, all functions are listed.
If a function has no called function, this column is empty.
For example,
Fueling_Modeis called byFailandfuel_rate_control_step. The number of call sites is included in parentheses.FailcallsFueling_Modetwice.